One Day Heatwave at Cambridge Botanical Gardens Made 20 Times More Likely By Climate Change, Experts Say
I’ve already covered the attribution study recently rushed out by scientists with regard to the very hot spell of weather in June. Now most of those same scientists have published a second attribution study which focuses on the 3 or 4 very hot days in northern France and Europe and the one very hot day in the UK on July 25th. Are we going to get a ‘It was climate change wot dunnit’ attribution study every time it gets hot in summer now? Looks like it.
As usual, the global media have given maximum coverage to this additional study which supposedly demonstrates that man-made global warming had its grubby fingerprints all over the second record breaking heatwave in Europe this summer. It’s as bad as, if not worse, than the original study and of course the headline claims that climate change made Europe’s July heat wave up to 3 degrees Celsius hotter, that the heat in France and Holland was made up to 100 times more likely and that in Cambridge up to 20 times more likely is pure hype.
Atmospheric blocking caused the July heatwave, just as in June
The authors say:
In a relatively similar way to the June case, the July heat wave occurred due to a ridge across western Europe (highly amplified Rossby wave), together with a low-pressure system developing offshore the Iberian peninsula, as shown in Figure 2. This weather pattern induced intense advection of hot air from North Western Africa across Spain to France (Figure 3) and then Germany and the Benelux, eventually reaching Scandinavia a few days later. In contrast to the June heatwave, this July heatwave was accompanied by severe drought conditions in areas such as France (a majority of French territory was under drought regulation measures), which might have been a confounding factor given that dry soils are suspected to cause an additional temperature increase at regional scales due to land-atmosphere feedbacks (Seneviratne et al., 2010).
So, once again, atmospheric dynamics play a significant role in directly causing the intense heat, just as we have seen they did in 2003 and 1947, although for summer 2019, the ‘heatwaves’ have been of very much shorter duration and I can find no reports of fatalities due to heat exhaustion for that very reason.
The attribution analysis was not done for Europe: it was done using average data from France only plus five individual weather stations in France, Holland, UK and Germany
Despite headline claims that this attribution study was about heatwaves in Europe and how they have been made much more likely by man-made climate change, it was not. The claim is incorrect and highly misleading. The results of this attribution apply strictly to just five individual weather stations, plus to metropolitan France in general but, as we will see the models were pretty useless for diagnosing trends throughout France and only moderately acceptable as diagnostic tools for the individual weather stations. But it gets worse, and worse again. Firstly, here is a list of the locations:
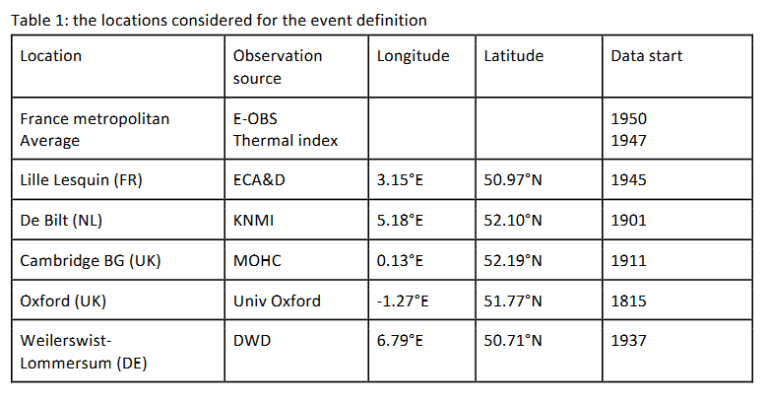
The only country wide data, which is for France only, is the France Metropolitan Average, which only goes back as far as 1950. Therefore it doesn’t even include data from the 1947 heatwave, not to mention any other heatwaves which might have occurred in the early part of the 20th century or even further back in the 19th century. So they’re doing an attribution analysis for France based on data from the modern period only using models which are biased to produce strong warming in the modern period and amazingly they find that man-made climate change had a significant impact! Only in climate science could this be justified. Any other field and it would be laughed out of the lab.
Only in climate science would scientists select five individual locations (weather stations each encompassing a microclimate of no more than a few hundreds of square meters) and perform a supposedly ‘rigorous’ attribution analysis, then plug their findings in the media as being somehow representative of the climate of an entire continent! It gets worse though; they didn’t just pick the stations, they cherry-picked them – outrageously cherry-picked them!
The rest of the analysis is based on a set of 5 individual weather stations. We selected the stations based on the availability of data, their series length (at least starting in 1951) and avoidance of urban heat island (UHI) and Irrigation Cooling Effects (ICE), which result in non-climatic trends. The locations considered all witnessed a historical record both in daily maximum and in 3-day mean temperature (apart from Oxford and Weilerswist-Lommersum where only daily maximum temperatures set a record).
The weather stations were deliberately selected because they set record high maximum temperatures, three of them also in 3 day mean temperature, which period was coincidentally also the basis for the event attribution, seeing as the ‘heatwave’ was so damned short it was over before it almost began! The choice of Cambridge Botanical gardens is even more hilarious because, as we have seen, the UK failed to live up to the Met Office’s hype and break the national all time temperature record of 38.5C. Then Cambridge University popped up and said that their botanical gardens managed 38.7C, so the Met office jumped at the opportunity to save face and they subsequently legitimised the ‘new record’ by ‘rigorously checking it for quality control’. LOL.
This was only a few days ago. The study’s authors must have then immediately leapt at the opportunity to include Cambridge Botanical Gardens in their ‘European Heatwave Attribution Study’ and stayed up all night presumably number-crunching the data from the station to ‘prove’ beyond all doubt that climate change must have come to Cambridge BG that day! I suspect this might be why there are two stations included in the study from the UK. But it gets even worse! They chose the station simply because the Met Office belatedly declared it as setting a new national maximum temperature record – despite its apparent unsuitability as pointed out by Paul Homewood. They also chose it knowing full well that the historic data was – shall we say – less than reliable:
The Cambridge Botanical Gardens (BG) station that observed the UK record temperature of 38.7 ºC has a sizeable fraction of missing data. On 23 July there were battery issues, this value has been estimated by the UK Met Office on the basis of their interpolation routine. For earlier years we used the values of the nearby Cambridge NIAB station with a linear bias regression T(BG) = (1+A) T(NIAB) + B, with A about 5% in summer and B -0.6 ºC in July, -0.9 ºC in August.
Can I believe what I just read? On one of the days specifically included in their event definition (July 23rd), the thermometer batteries were on the blink so the Met Office had to estimate the data for that day and the authors used a nearby station to fill in the gaps for the large chunks of historic data (going back to 1911) missing from the station! All this, just so they could include the Botanical Gardens in their study, simply because it was the site of a decidedly dodgy UK all-time maximum temperature record! If that is not an ideologically driven choice by supposedly diligent, cautious, rational, and above all unbiased scientists, I don’t know what is. But there’s more! This is the study which just keeps giving.
Like the June study, the models are crap but in this case not crap enough – simply because of the choice of locations
Figure 5 compares the GEV distribution parameters between model ensembles and observations. In general, the same conclusions hold regarding models skill as in our analysis of the June heatwave [i.e. the models are crap at simulating the actual observations]. Models have a too high variability and hence overestimate the sigma parameter, sometimes by a large amount (factor 1.5 to 2.5). This is particularly marked for the France average. However, HadGEM3-A, EC-EARTH, IPSL-CM6-LR and CNRM-CM6.1 appear to have a reasonable departure from observations. For the other models the 95% confidence intervals on the scale parameter does not overlap with the confidence interval on the scale parameter from the observations, which is our criterion for inclusion of the models in the attribution.
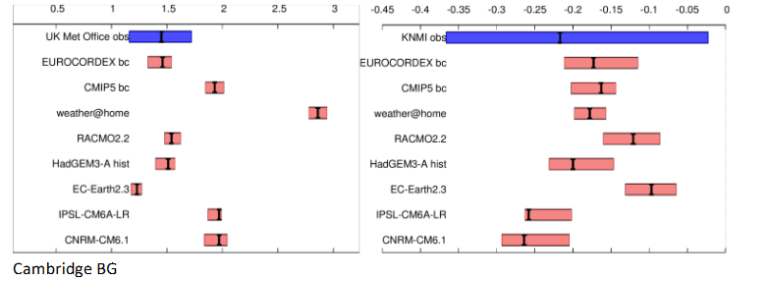
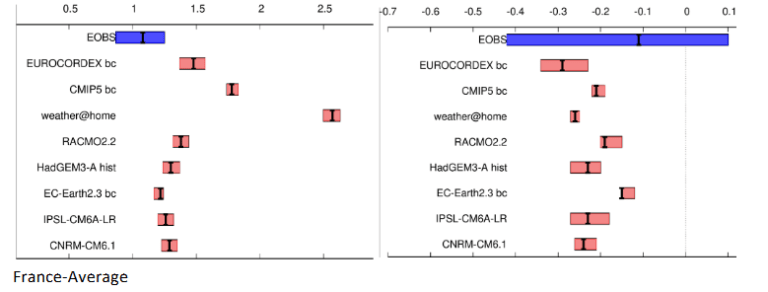
Note that the models perform worse when it comes to the whole of France observations, i.e. the data over a much wider area. For the individual cherry-picked stations, they perform OK (just).
For individual stations studied here shape parameters are well simulated. The discrepancy for the scale parameter is also reduced except for weather@home where variability remains too high. The difference in behavior between the France average and the stations could arise from several reasons and remains to be investigated.
The issue requires an in-depth investigation, but probable reasons may be in a difficulty of models to correctly simulate land-atmosphere interactions, resulting in a deficit of skill for the simulation of heatwaves especially in regions where evapotranspiration regimes undergo transitions from energy-limited to soil-moisture limited regimes. Preliminary investigations into the deficits of weather@home have shown that an insufficient cloud cover in the model leads to unrealistically high hot extremes and low cold extremes. Another possible cause is dynamical as France may occasionally be influenced by episodic advection of hot and dry air from Spain and North Africa leading to large excursions of temperature which models might not capture well.
Yep, blah, blah, blah, etc. etc. Finally they get to the probable real reason why there’s a difference in model performance between individual stations and whole regions – a flipping great plume of hot air from Africa caused the heatwave and made it much more likely that very hot temperatures would be experienced on said days of the heatwave! They already bloody said this is what caused the extreme temperatures!
The source of the unusual heat was North Africa, scientists say, drawn up to Europe because of high pressure to the east of the UK.
[https://thefinancialanalyst.net/2019/08/02/climate-change-made-europes-2019-record-heatwave-up-to-100-times-more-likely/]
It’s one reason why it got very hot, up to 3.5C hotter than when it last got very hot, in 2003 and 1947. Other reasons include land use, urbanisation, station siting and yes, a general long term warming trend observed in the average temperatures of European summers. But what do our intrepid ‘scientists’ do? They use models which barely fit observations and they hype their own findings by falsely informing the public that the whole of the increase in record daily max temperatures can be attributed to man-made climate change. They also tell us that man-made climate change has made it up 100 times more likely that these extremes will occur!
Geert Jan van Oldenborgh (KNMI), one of the study’s authors admits all this to Carbon Brief, but the alarmist headlines remain and none of the scientists involved seem concerned in the least about the impression given to the public, even reinforcing that impression themselves in their press interviews.
As part of the analysis, the authors also looked at how extreme the temperatures seen during the July heatwave were in comparison to those seen in the past.
The authors find that the temperatures seen during this heatwave were around 3C higher than they would have been in 1900.
This is double the heatwave temperature increase expected by climate models – which are used to make projections about future climate change, van Oldernborgh says:
“The models only predict that heatwaves get warmer at about 1.5C per degree of global warming. So for every degree of global warming, they predict that heatwaves get 1.5C hotter – a little bit faster but not really exceptional.”
The world has seen around 1C of global warming so far – meaning that the models would expect heatwaves to be around 1.5C hotter today than in pre-industrial times. However, temperatures during this heatwave were actually around 3C warmer, he says:
“We really need to do a lot more serious research than we can do within one week to look at why there is such a big discrepancy between the observed trends and the modelled trends. [No. Shit. Sherlock]
“But heatwaves are very special. A lot of things come together for a heatwave – heat from the Sahara, local heating due to sunshine, the reaction of vegetation due to very hot conditions – and all these things have to be modelled right. I’m just afraid that these models that have been designed to project the average climate correctly cannot handle these very extreme situations very well.”
So what have we learnt? We’ve learned that models are rubbish at analysing the human fingerprint in extreme weather events, but that scientists still use them and express over-confidently their opinions about how climate change has significantly altered the frequency and intensity of extreme heatwaves, using those models, combined with sparse data, poor data and unsuitable data. These opinions then get relayed to the media as ‘fact’ and idiot climate activists, Greens and lefty politicians double down on ‘climate crisis deniers’ as these ‘facts’ accumulate in the public arena.

De pre-1950 data for De Bilt was recently homogenized downward.
LikeLike
The greatest minds of the day solving the climate crisis
LikeLiked by 3 people
Heat seekers desert Faversham in droves as the all-time English temperature record is smashed by a massive 0.2oC at the University Botanical Gardens. Heat seekers follow their thermometers and transhume to Cambridge, basking in the remnants of the 38.5 °C (101.3 °F) set during 25 July. For 16 long years we have kept them, a despairing Faversham town councillor wailed. And our record was set in a proper climate station, not some gardener’s pastime.
Big plans are afoot for the Botanical Gardens. There is an internecine struggle between head gardeners between those advocating the Saguaro desert route, and others demanding due attention be paid to the strong possibility of Cambridge becoming a tropical rainforest. Urgent advice is being sought from the Met Office climate mandarins but they cannot agree.
Meanwhile the person who opened the window causing a reflection flash to heat up the Botanical Gardens Stevenson Screen at the precise moment the temperature record was set, is still in hiding and in fear of his life.
LikeLiked by 1 person
it’s been decided Alan that Cambridge BG will be the hot, dry Arizona desert on Thursdays (in honour of when Africa came to Cambridge), then a tropical rain forest at the weekends when Clausius-Clapeyron re-asserted its rule over the climate of our (erstwhile) most prestigious University town, filling reservoirs and even destroying dams as it traveled north to the wilds of Debyshire.
LikeLike
The relatively recently built Sainsbury Lab at CUBG prevents the site attaining WMO Class1 classification.
LikeLike
Joe, the site was evidently not suitable to use to claim a new national maximum temperature record. The fact that it was used for that purpose speaks volumes about the Met Office’s priorities and about the priorities of the scientists who used that station’s data in their attribution analysis.
LikeLike
According to the ranked CET table, July 2019 was the 40th warmest July, coming just behind July 1793 and 1803.
LikeLike
When heatwaves were heatwaves and lasted longer than three days: https://en.wikipedia.org/wiki/List_of_heat_waves
“1906 – United Kingdom heat wave which began in August and lasted into September broke numerous records. On the 2nd, temperatures reached 36 °C (97 °F) which still holds the September record, however some places beat their local record during September 1911 and September 2016.
1911 – The 1911 United Kingdom heat wave was one of the most severe periods of heat to hit the country with temperatures around 36 °C (97 °F). The heat began in early July and didn’t let up until mid September where even in September temperatures were still up to 33 °C (91 °F). It took 79 years for temperature higher to be recorded in the United Kingdom during 1990 United Kingdom heat wave.
The 1955 United Kingdom heat wave was a period of hot weather that was accompanied by drought. In some places it was the worst drought on record, more severe than 1976 and 1995.
The 1976 United Kingdom heat wave was one of the hottest in living memory and was marked by constant blue skies from May until September when dramatic thunderstorms signalled the heat wave’s end.”
By that time, politicians had started to wonder if they could perhaps control the weather and the Labour government appointed a Minister for Drought, the avuncular Denis Howells, formerly the Minister for Sport.
https://www.birminghammail.co.uk/news/local-news/memories-of-brum-mp-mp-denis-68929
And of course it worked, because within days of his appointment there were thunderstorms and flash flooding. Howells was then appointed Minister for Floods and additionally, during the harsh winter of 1978–1979 he was appointed Minister for Snow.
His successes are still hailed (sic) today and there are very few politicians nowadays who do not believe that governments can control the weather.
LikeLiked by 1 person
Erasing the past to deceive the present and steal our future.
LikeLike
The rest of the world catches up with Cliscep, eventually:
“Pressure is likely to grow in the coming days for the U.K. Met Office to make a full public statement about the state of its nationwide temperature measuring stations. This follows sensational revelations in last Friday’s Daily Sceptic that nearly eight out of ten sites had huge scientifically-designated ‘uncertainties’ that essentially disqualified them from providing the accurate data required to promote the collectivist Net Zero agenda.
On July 25th, 2019, the site at the Cambridge Botanic Gardens was credited with an new U.K. temperature record of 38.7C°. The Cambridge Botanic Gardens is a Class 5 site, and it still holds the July record for the region of East Anglia. All these records should be removed, or at least flagged with the large uncertainties set down by the WMO.”
https://dailysceptic.org/2024/03/04/met-office-must-account-for-the-junk-temperature-data-propping-up-net-zero-insanity/
This post demonstrated back then that media propagandising and official designation of the dodgy temperature ‘records’ alone was not the only way that alarmists were promoting the collectivist Net Zero agenda; they were actually publishing pseudoscientific attribution studies claiming that one Class 5 temperature ‘record’, set on one day, was evidence of climate change. Unbelievable.
LikeLiked by 1 person
“Scientists Expose Major Problems With Climate Change Data
‘Climate activism has become the new religion of the 21st century—heretics are not welcome and not allowed to ask questions,’ said astrophysicist Willie Soon.”
https://www.theepochtimes.com/article/prominent-scientists-challenge-key-data-underlying-climate-change-agenda-5593800
LikeLiked by 1 person
20 times more likely? Pah! That’s nothing!
“Climate change made US and Mexico heatwave 35 times more likely”
https://www.bbc.co.uk/news/articles/czvvqdg8zxno
Any advance on 35?
LikeLike