Reposted from ClimateContrarian
There’s a post published at Watts Up With That which provides a sneak preview of some CMIP6 models runs for the upcoming release of the IPCC’s AR6 (Part 1: Physical Science Basis due in April 2021). As the author, Andy May says:
The new IPCC report, abbreviated “AR6,” is due to come out between April 2021 (the Physical Science Basis) and June of 2022 (the Synthesis Report). I’ve purchased some very strong hip waders to prepare for the events. For those who don’t already know, sturdy hip waders are required when wading into sewage.
Andy has looked at some of CMIP6 climate model runs posted on KNMI Explorer and this is what he found:

The base period is 1981-2010 and the emissions pathway is ssp245, which is similar to the old RCP4.5 concentration pathway. Most as you can see project global warming in 2100 to be somewhere between just over 1.0C and 2.5C, which in itself is quite a spread. But then you look at UKESM1.0 (light blue) and CanESM5 (yellow – partly obscured) and they are projecting warming anywhere between about 2.5C and 3.8C. They stand out like sore thumbs in 2100, as does UKESM1.0 hindcast warming in the 1960s using historical forcings. As you can see, UKESM1.0 cools the mid 20th century cooling period by -1.5C compared to 1981-2010! That is huge and is not borne out by actual observations. I went into the reasons for this discrepancy here.
To get a clearer picture of how UKESM deviates from actual measurements, here are the graphs of Hadcrut 4 against the model runs:
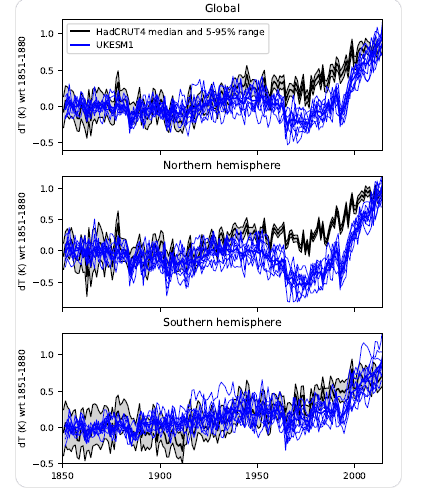
Quite obviously, UKESM1.0 vastly overstates mid 20th century cooling in the northern hemisphere. Why? Because it greatly overestimates the impact of anthropogenic aerosol cooling. Here is what the Met Office say about UKESM1.0 and the physical general circulation model on which it is based:
The Earth System Model UKESM1, and the physical model (or General Circulation Model) it is based on, HadGEM3-GC3.1 are the result of years of work by scientists and software engineers from the Met Office and wider UK science community.
Analysis shows the climate sensitivity of the models is high. For both models the Transient Climate Sensitivity (TCR) is about 2.7 °C, while the Equilibrium Climate Sensitivity (ECS) is about 5.4°C for UKESM1 and about 5.5°C for GC3.1. Future projections using the new models are in progress. When these have been analysed, we will have a better understanding of how the climate sensitivity affects future warming and associated impacts.
Very high sensitivity means that historic aerosol forcings must be correspondingly high in order for the model to align with current (presumed highly accurate) global mean surface temperature data. But the aerosol forcing is so high that it ends up unrealistically cooling the 1960s. As I pointed out:
UKESM1 massively overstates mid 20th century cooling but it has to if it is to get the rest of the historical record more or less correct with such a ridiculously high sensitivity built in. Note that it is indeed overestimated aerosol cooling which is responsible for this 20th century mismatch because it is much more pronounced in the Northern Hemisphere where most of the heavy industry was and still is.
The Met Office confirms that large anthropogenic aerosol forcings were incorporated into the development of UKESM1.0:
UKESM1 is developed on top of the coupled physical model, HadGEM3-GC3 (hereafter GC3). GC3 consists of the Unified Model (UM) atmosphere, JULES land surface scheme, NEMO ocean model and the CICE sea ice model. The UM atmosphere in GC3 is Global Atmosphere version 7 (GA7). Inclusion in GA7 of both a new cloud microphysics parameterization and the new GLOMAP aerosol scheme led to a concern the model might exhibit a strong negative historical aerosol radiative forcing (i.e. a strong aerosol-induced cooling due to increasing anthropogenic emission of aerosol and aerosol precursors over the past ~150 years) with potentially detrimental impacts on the overall historical simulation of both GC3 and UKESM1.
A protocol was therefore developed to assess the Effective Radiative Forcing (ERF) of the mainclimate forcing agents over the historical period (~1850 to 2000), namely; well mixed greenhouse gases (GHGs), aerosols and aerosol precursors, tropospheric ozone and land use change. This protocol follows that of the CMIP6 RFMIP project (Andrews 2014, Pincus et al. 2016). The aim was to assess the change in the mean top-of-atmosphere (TOA) ERF between average pre-industrial (~1850 in our experiments) and present-day (~2000) conditions. In particular to assess the aerosol ERF, with a requirement that the total (all forcing agents) historical ERF be positive. Initial tests revealed an aerosol ERF of -2.2 Wm-2, significantly stronger than the -1.4 Wm-2 simulated by HadGEM2-A (Andrews 2014) and also outside the IPCC AR5 5-95% range of -1.9 to -0.1 Wm-2. As a result of the large (negative) aerosol ERF, the total ERF diagnosed over the historical period was approximately 0 Wm-2.
They were so large initially that they had to find a method of actually reducing them:
We therefore investigated aspects of GA7 that could be causing this strong aerosol forcing and, where possible, introduced new processes and/or improved existing process descriptions to address these. The goal of this effort was to develop an atmosphere model configuration solidly based on GA7.0 that:1.Had a less negative aerosol ERF and thereby a total historical ERF of >+ 0.5 Wm-22.
The above is bad enough news for the historical authenticity of UKESM1.0 and hence its reliability in terms of future projections, but it gets worse. A paper recently published argues that anthropogenic aerosol forcings cool the climate even less than originally thought, meaning that UKESM1.0 is even more out of sync with reality than as described above:
“Our conclusion is that the cooling effect of aerosols on clouds is overestimated when we rely on ship-track data,” says Glassmeier. “Ship tracks are simply too short-lived to provide the correct estimate of cloud brightening.” The reason for this is that ship-track data don’t account for the reduced cloud thickness that occurs in widespread pollution. “To properly quantify these effects and get better climate projections, we need to improve the way clouds are represented in climate models,” Glassmeier explains further.
Oh dear, it’s not looking good for the Met Office’s ‘flagship’ CMIP6 climate model. Maybe they need to raise the white flag of surrender. It’s not much better for the Canadian model either, or in fact any of the CMIP6 13 model ensemble according to Andy May.
Historical forcings are used prior to 2014 and projected values after. The blue and orange curves are from two runs from a single Canadian model. The two runs are over 0.2°C different in 2010 and 2011, some months they are over 0.5°C different. There are multiple periods where the model runs are clearly out-of-phase for several years, examples are 2001-2003 and 2014 to 2017. The period from 2015 to 2019 is a mess.
I’m unimpressed with the CMIP6 models. The total warming since 1900 is less than one degree, but the spread of model results in Figure 1 is never less than one degree. It is often more than that, especially in the 1960s. The models are obviously not reproducing the natural climate cycles or oscillations, like the AMO, PDO and ENSO. As can be seen in Figure 2 they often are completely out-of-phase for years, even when they are just two runs from the same model. I used the Canadian model as an example, but the two NCAR model runs (CESM2) are no better. In fact, in the 2010-2011 period and the 2015-2019 period they are worse as you can see in Figure 4.

to repeat what I said at Jaime’s blog:
I read Andy May’s article at WUWT and also the first chapter of his new history of the climate wars on Amazon. He has the rare talent of dealing with technical stuff thoroughly in a way that the non-scientist can understand. And so has Jaime.
LikeLiked by 1 person
I have to wonder what’s going to happen within AR6 regarding the increasingly large reality gap between newer model outputs and observations, and what this means for the conclusions that will be drawn from AR6 regarding impacts. In AR5, as long as you stay below the SPMs at any rate, it just hangs on to consistency, and indeed the impacts reflect this as being ‘an issue’, but in no way shape or form ‘a high certainty of imminent global catastrophe’. *If* it is bias towards the latter narrative driving the models, and hence likely driving the expectations of high very impact too, then the gap between narrative and reality will have moved from largely outside of the science, so to speak, to largely inside. Yet how can this be resolved? Especially as coming from another direction, moderate voices in science have pretty much succeeded in throwing out RCP8.5 as a use for realistic impact assessment. Somewhere here, it seems to me, there are two things happening that can’t possibly meet in the middle, so what will happen?
LikeLike
Andy,
Gosh, it’s more complicated than we thought. First there were the RCPs, then there were the SSPs (shared socio-economic pathways 1-5) and then there were the combined SSPs and RCPs!
So, ssp245 as above is SSP2 + RCP4.5. Don’t ask me what this means in practice because I just don’t know, but as regradrs the individual components:
SSP2 (according to Carbon Brief) –
Middle of the Road (Medium challenges to mitigation and adaptation)
The world follows a path in which social, economic, and technological trends do not shift markedly from historical patterns. Development and income growth proceeds unevenly, with some countries making relatively good progress while others fall short of expectations. Global and national institutions work toward but make slow progress in achieving sustainable development goals. Environmental systems experience degradation, although there are some improvements and overall the intensity of resource and energy use declines. Global population growth is moderate and levels off in the second half of the century. Income inequality persists or improves only slowly and challenges to reducing vulnerability to societal and environmental changes remain.
So, combined with the 4.5W/m2 by 2100 GHG forcing scenario RCP4.5, this seems to me like it is the real ‘business as usual’ scenario, where some countries (like the UK) sacrifice themselves – and their populations – upon the altar of sustainability but other countries do realtively little. This seems to be how the world is working out at the moment.
I did actually write a while ago about the SSPs and how they seem to be undermining the role of the climate models themselves.
“The IPCC appears to be rapidly switching emphasis from the science (which, it is implicitly claimed, is now largely settled, barring a few minor tweaks here and there, and improvements to models) to socio-economic projections and associated mitigation/adaptation strategies. Literally, they are telling us our future survival depends upon how we choose to live in the next 80 years, because the science of AGW is basically done and dusted and we know enough about how the climate changes naturally to be able to now project reliable estimates of future warming based mainly upon anthropogenic GHG concentrations (derived via emissions scenarios). Nothing could be further from the truth.
After the passage quoted above, Zeke goes on to say:
They show that it would be much easier to mitigate and adapt to climate change in some versions of the future than in others. They suggest, for example, that a future with “resurgent nationalism” and a fragmentation of the international order could make the “well below 2C” Paris target impossible.
If this doesn’t ring alarm bells about what is motivating the UN IPCC and its development of the new SSPs, I don’t know what will. The UN are clearly envisaging in the not too distant future the development of a globalist political infrastructure which will override nationalist concerns.”
If I had to guess what will happen with the future of IPCC-driven ‘climate science’ I would say that the models will increasingly take a back seat in the projection of future climate change, but they will be used more and more to estimate short term impacts like extreme weather, for which I imagine the Met Office’s UKESM1.0 will come in very handy. But that’s just a guess. We’ll have to wait until April to see what the ‘science basis’ is going to say
LikeLiked by 1 person
Jaime, thank you. More of this, please!
LikeLiked by 2 people
quote from above – “If this doesn’t ring alarm bells about what is motivating the UN IPCC and its development of the new SSPs, I don’t know what will. The UN are clearly envisaging in the not too distant future the development of a globalist political infrastructure which will override nationalist concerns.”
read a book a few years back (can’t recall the title) about the people that instigated the EU had that goal in mind also, makes you wonder!!!
LikeLike
Nic Lewis has an article at Judith Curry’s. Basically showing that the high climate sensitivity, high aerosol forcing models in CMIP6 do not agree with actual observations:
In the paper’s discussion section the authors conclude:
Both more positive (high ECS) and less positive (low ECS) cloud feedback models are able to simulate the observed global-mean temperature record, but T9 models do it through a combination of strong warming from GHGs and strong cooling from aerosols, while B9 models do it with moderate warming from GHGs and modest cooling from aerosols. Because historical aerosol forcing has been larger in the Northern Hemisphere, the strong aerosol-cloud interactions cooling effect in T9 models produces a distinctive historical interhemispheric surface temperature evolution (red line in Figure 4b), which is inconsistent with that in observations over 1950–2000 (black line in Figure 4b). These results support the recent findings that the CMIP6 models more faithfully capture the observed evolution of surface anomalies across a range of quantities over 1980–2014 tend to have lower 21st century projected warming.
Only five out of the thirty CMIP6 models analysed are B9 models (those which are consistent with the evolving interhemispheric surface temperature contrast) that are also in the top 15 models for consistency with historical GMST warming.[9] Their range of estimated ECS is 1.81–2.86 K, with a mean of 2.5 K, far lower than the mean of 3.7 K for all the models. Those institutions that have developed CMIP6 models with ECS values comfortably above 4.5 are increasingly looking as if they may have taken a wrong turn somewhere. Somewhat surprisingly, they include several highly regarded modelling centres, such as NCAR and the UK Met Office.
In other words, they’re junk.
LikeLike
“Highly regarded” by whom exactly? The Met Office have spent a bagillion quid (exaggerating slightly) on a series of ever more potent calculating machines, and have turned out an embarrassing splodge of rubbish – as, I judge, many sceptics will have predicted. No doubt they will have done as good a job as would a single individual with a laptop in their basement working with a free spreadsheet program and publicly available forcing and temperature data. If all they are doing is making a linear regression from predictor variables of opposite sign, plus maybe an artful bit of wiggle, they could have done without even the spreadsheet.
It’s not as if it is a novel issue. That the effect of aerosols was likely estimated too high to compensate for oversensitivity to greenhouse gases has been a frequent criticism in past years. And the range of ECS of the previous generation of models was heavily dependent on cloud feedback, of which the models could not agree the sign. And again now: they cannot agree the sign.
And for those who admire how close these models resemble one another, try looking at a graph where their true temperatures are shown, not anomalies. The first time I saw such a figure for CMIP5 models I could not believe my eyes.
These things are trash – pretty, sophisticated, but trash. To squander our future prosperity on their say so is no better than reading the tea leaves. But our glorious leaders are intent on whipping us over that cliff.
LikeLiked by 1 person
JIT,
Highly regarded, as in ‘lauded by an inner circle of experts and highly cited by said experts’ – same as Imperial’s ‘highly regarded’ epidemiological modelling unit.
LikeLiked by 1 person
Mann has just disappeared the AMO, using volcanic aerosols in the pre-industrial era and anthropogenic aerosols in the modern era! LOL. This is going to be fun, I can see. Ken Rice and Richard Betts have already chosen sides against Roger Pielke Jr. and Judy Curry.
LikeLike
@ Jaime the article at Climate etc. made for an interesting read. This extract from Mann’s own abstract is jaw-dropping:
Has Science really fallen so far that it allows the absence of an oscillation in a GCM as support for its absence in the real world? There are no tornadoes in GCMs either, is this also evidence that they don’t exist? (Apologies for the slight frippery. Of course there are magnitudes of difference in scale and duration). But on what basis should a GCM be expected to recreate internal variation in climate states?
I was just reading about neutrinos. In 1956 a paper in Science announced the detection of this particle. Is this truly the same journal?
LikeLiked by 1 person
JIT, this new ‘research paper’ by Mann confirms that he is now at the forefront of a full-blown anti-science drive ahead of COP26 which will try to convince the world that reality is what the climate models say it is and that there is virtually no aspect of our modern day weather and climate which is not altered or even created and sustained by emissions of man-made GHGs. I think they have become emboldened by the stunning successes of the Covid anti-science movement and climate ‘scientists’ – who have always had only a passing regard for empirical data and evidence anyway – now wish to emulate that success by jumping the shark and dispensing with ‘natural’ phenomena to focus exclusively on a climate and weather system driven mainly by anthropogenic GHGs and aerosols, which emerges from the models, which the real world must be forced to conform to.
“The finding — which is bound to generate significant controversy and pushback from the weather and climate communities due to how broadly accepted the concept of the AMO has become — may very well shake the foundations of understanding of what has been driving historical hurricane cycles.
Simply put, if true, this discovery means that during the 20th century and beyond, humans — not natural variability — have been the main driving force in the up-and-down cycles of hurricane activity in the Atlantic Ocean.”
https://www.cbsnews.com/news/climate-change-atlantic-hurricane-activity-cycles/
LikeLike
Jaime, I doubt Mann’s effort had any Covid influence at all. He’s likely been pursuing this angle for a long time and maybe even prepping for the actual paper before that even arose. However, with luck the push-back may be sufficient to make it obvious to everyone that Mann doesn’t represent the mainstream at all in climate-science, but a fringe outlier.
LikeLike