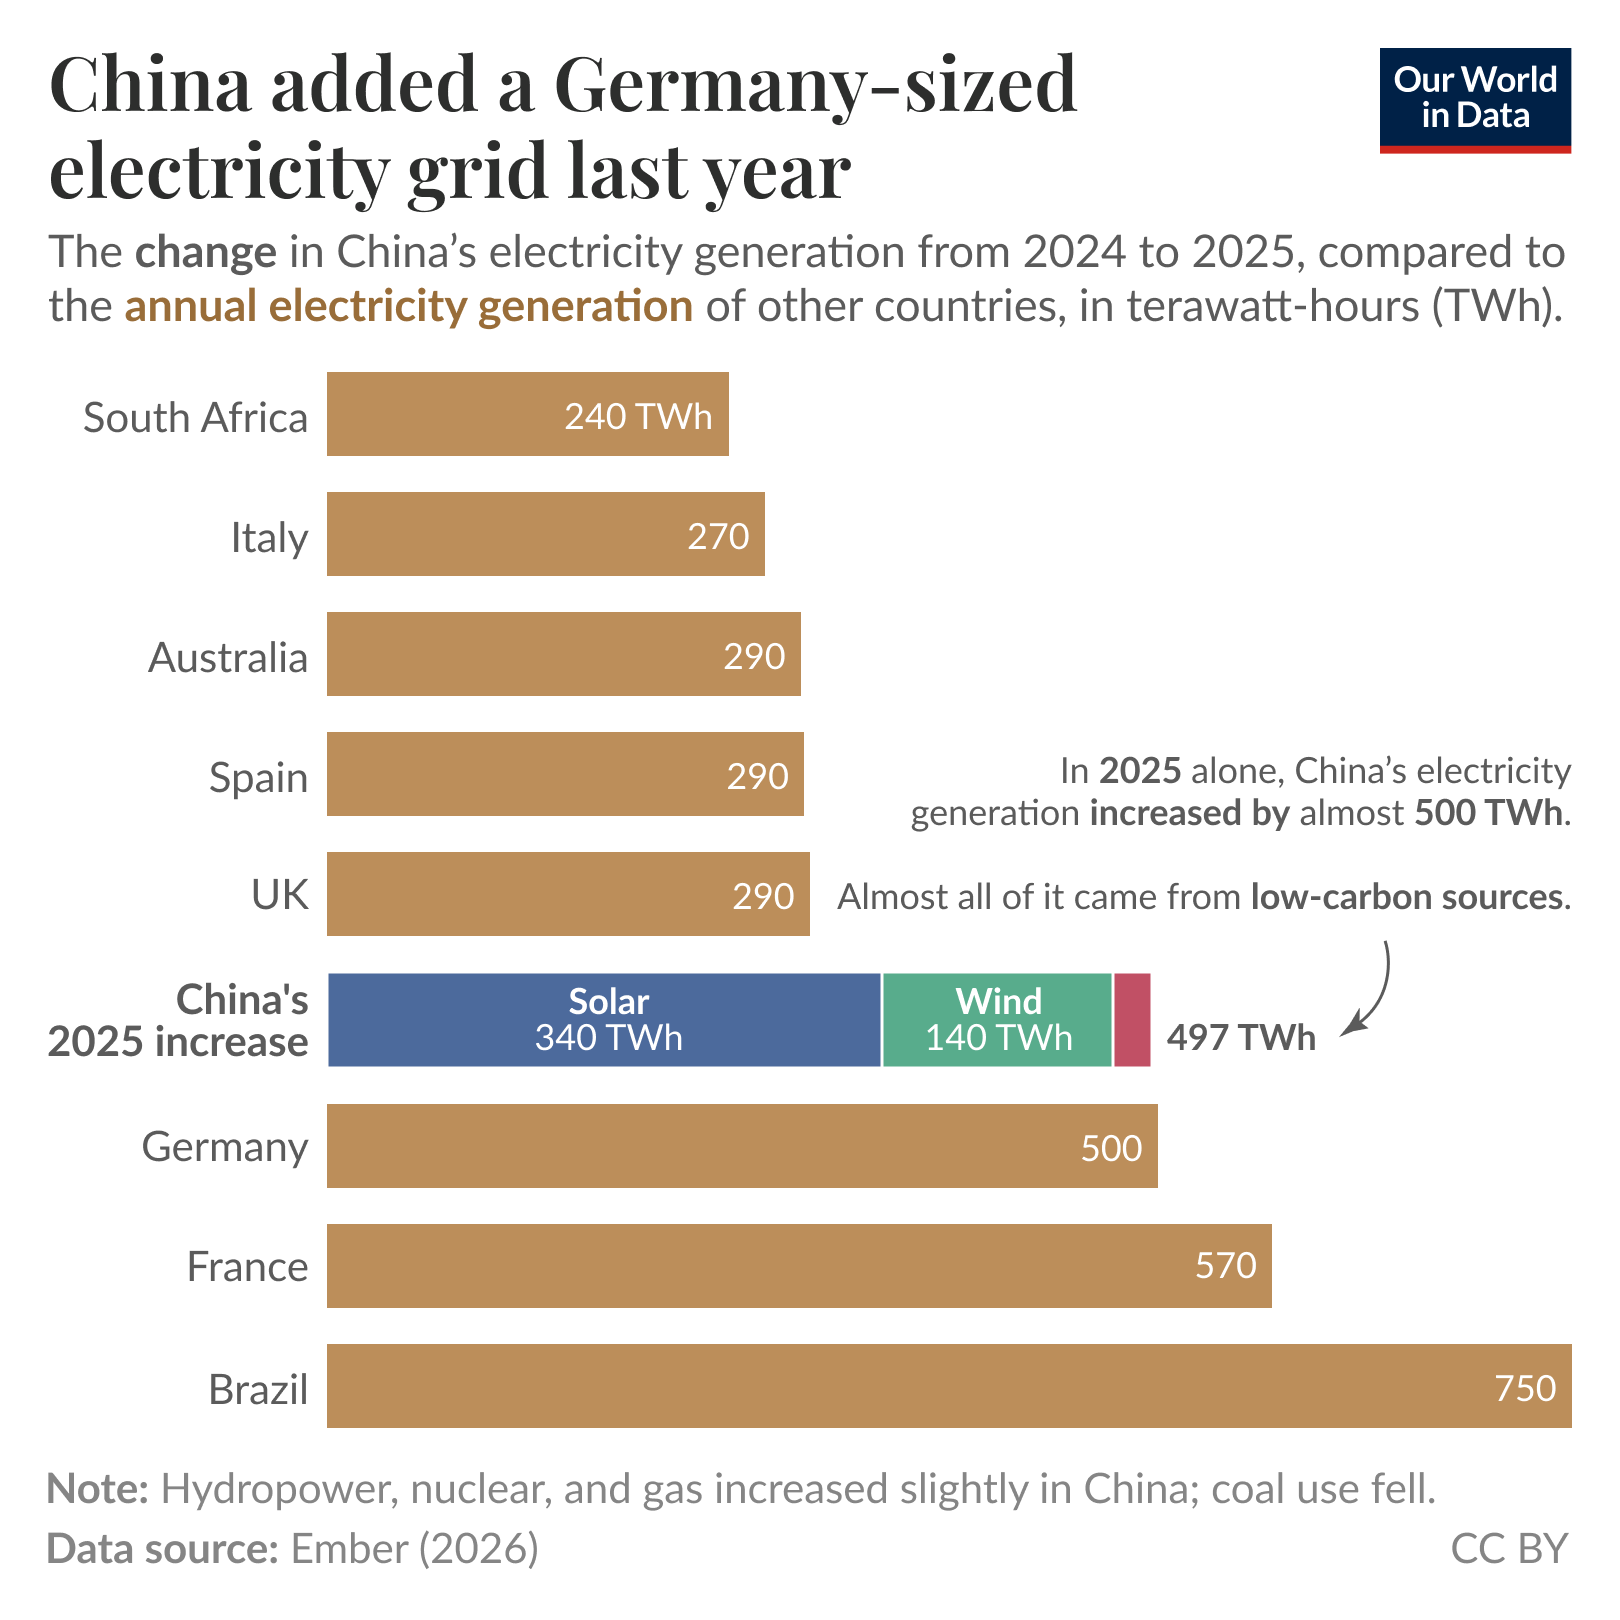
The other day, I received a figure (below). It shows that the growth in Chinese electricity generation equalled the entirety of Germany’s generation (and that it was mostly solar). Is it true? I don’t know. Let’s find out together: I’m writing this as I search for clues.
The first point to note is that China’s grid is much larger than Germany’s, so a modest rise in China’s might easily equate to all of Germany’s. I suspect that the grids of the UK and Germany are “shrinking as they grow”: the installed capacity is increasing, but the joules delivered is decreasing. However, I’ll check that for Germany in a moment.
The figure’s proximal source was Our World in Data, and if you look closely, you’ll see that their source, in turn, was Ember.
So first, I think I need to find out where Ember got the numbers from. As Mark is fond of showing, Ember is not a disinterested party when it comes to presenting energy statistics: it has a habit of promoting renewable electricity. That does not mean their data are bogus – but it does mean that they should be held under suspicion until proven correct. (The foreword to their 2026 Global Electricity Review – which I hope is going to give me the data on which OWID’s figure is based – has a foreword by none other than Bryony Worthington.)
Says Worthington,
This year’s Global Electricity Review shows that an alternative [to fossil energy] is not only emerging but scaling quickly, with clean power meeting all growth in global electricity demand.
She also says that
As Ember works with the Energy Institute on the forthcoming Statistical Review of World Energy, there is an opportunity to build on this perspective across the wider energy system — combining a robust global energy dataset with deeper insight into the structural changes now underway.
So the Statistical Review of World Energy (formerly collated by BP) now has a pro-renewable outfit embedded within it? That may go some way to explain the aberrations within the 2025 report. According to their article on energy security (p10):
Investment in renewables in particular is increasingly being seen as a cornerstone of energy security, enabling countries to disconnect their energy systems from global fuel markets and geopolitical tensions.
Whatever this does, it does not improve energy security unless you mine the materials and manufacture your renewable electricity machines at home. Which Europe does not. It does not improve energy security if the installation of renewables enforces a giant and scattered grid dependent on the weather.
Anyway, to the data. Here’s where Ember says China’s come from:
Annual electricity generation is taken from EI. This data is based on annual data from the China Electricity Council, with some adjustments made to fossil generation. Solar, Wind and Nuclear generation for 2023 are directly taken from NBS.
But the latest EI report only has data up to 2024. Luckily, the NBS (China’s statistical service) does have 2025 data. So, what do they show?
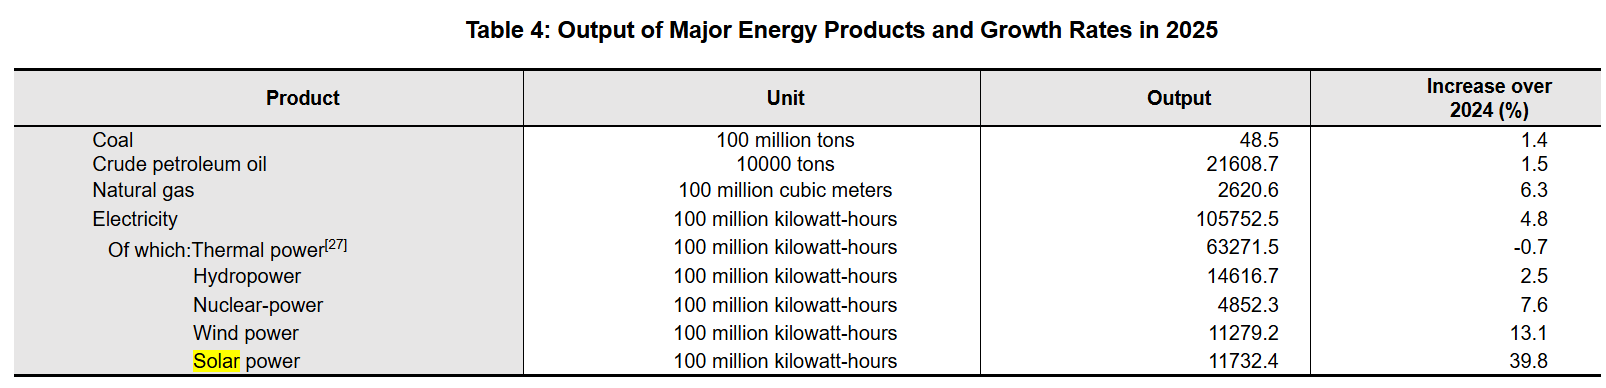
Well, the units are quite unusual, but there are 11732.4 of them. The increase is quite striking, at 39.8%. So, now it should be easy to back-calculate the added generation. There were 8392.3 of these units in 2024, and the difference is…
3340.1
OWID says 340 TWh, and if you convert the Chinese units into TWh, they say the increase is 334 TWh. So, not far enough out to quibble with.
What about Germany’s generation? Eurostat is quite slow to update, and has only data for 2024, like the Energy Institute. Of interest is the decline in Germany’s generation over the past few years: 578 TWh in 2022, and 497 TWh in 2024. Ember says their generation is now 500 TWh, and I have no reason to doubt that (it could be lower).
So the headline claim (wind data not checked, assumed correct based on the solar numbers) is highly likely to be true.
We can calculate the capacity factor of China’s solar photovoltaics, based on the statement that the installed capacity was 1202 “million kilowatts” (1.2 Terawatts).
I make that 11.1%, although I think to be fair we should increase that by 17% to allow for the gradual deployment of generation over 2025, giving 13% CF. It means, of course, that China’s grid is increasingly underutilised, and increasingly swingy. If sceptics believe anything, it is that this will increase costs and decrease that country’s competitive edge. As to that, we will wait and see. [Asterisk: in the UK, solar power has a narrow peak, about noon. For countries with a larger range of longitude than the UK, this swinginess is naturally blurred.]
From installed capacity, we can estimate the land area covered by solar photovoltaics in China. I make that 2.4 million hectares, or about a tenth of the footprint of the UK, and larger than the area of Wales. The annual increase must have been 600,000 hectares: larger than the area of the county of Norfolk.
The back of an envelope says that electricity is 25% of China’s primary energy in 2025, and that 60% of electricity is thermal, so quite neatly, 10% of China’s energy is not fossil based.
The Chinese National Bureau of Statistics also helpfully lays out how many gold medals its athletes won in 2025, in case you were wondering.
In 2025, Chinese athletes won 146 world championships in 31 sport competitions and broke 17 world records. At the 9th Asian Winter Games in Harbin, Chinese athletes won 32 gold medals, 27 silver medals and 26 bronze medals, with a total of 85 medals, ranking first in both the gold medal tally and the overall medal standings, marking the best performance by a Chinese delegation in the history of the Asian Winter Games. Chinese athletes with disabilities won 179 world championships in 23 international sporting events.
/message ends
Postscript
OWID is not beyond spinning data. This was presented today on their “Data Insights” page:
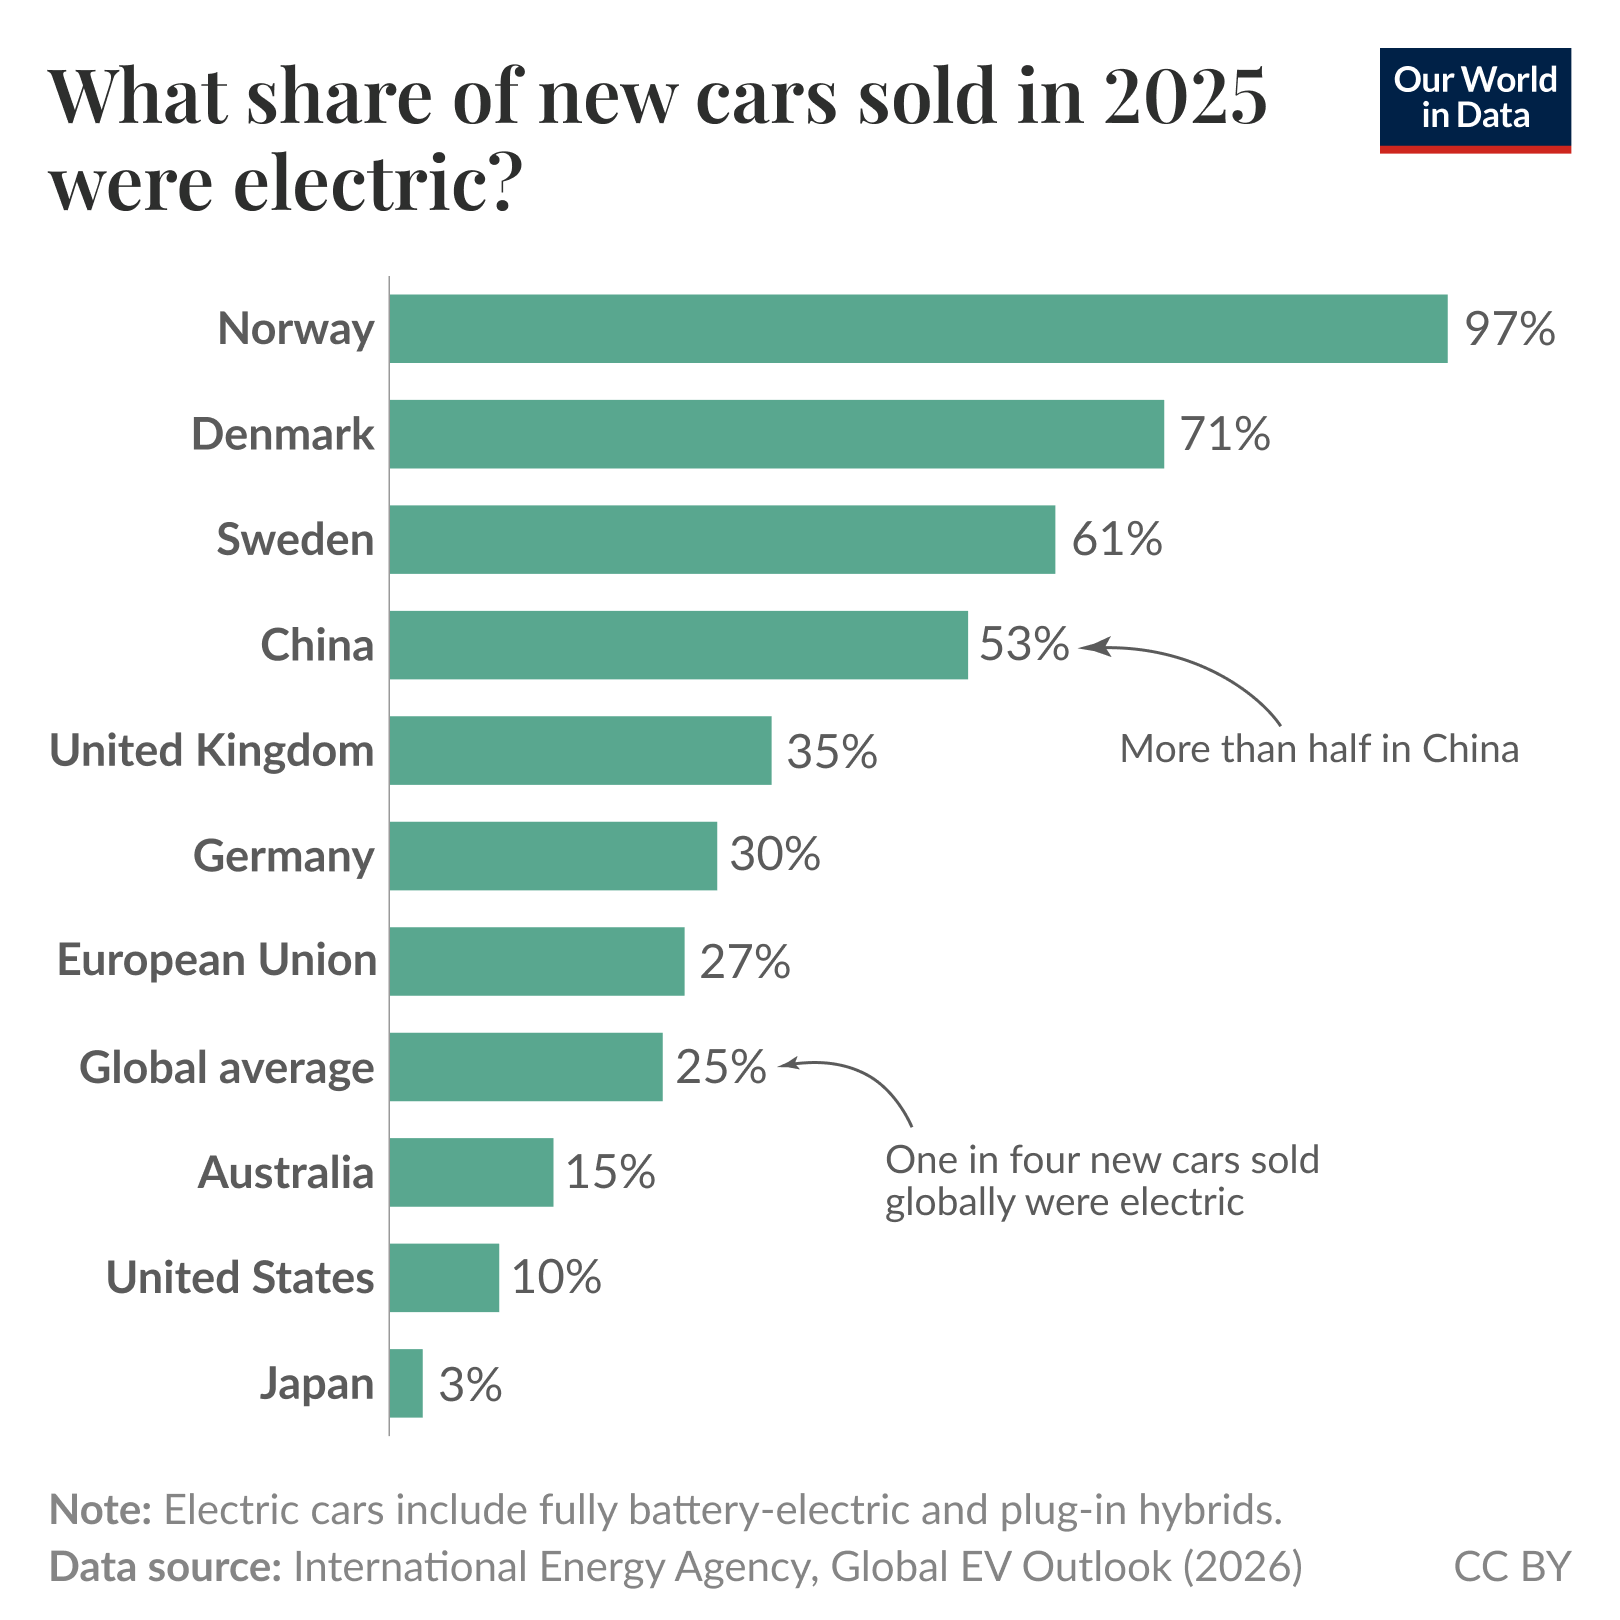
Don’t forget to read the small print.

WordPress just offered to turn this and other recent posts into a two-host podcast. The mind boggles at what auto-generated content we are going to be assailed with, going forwards. It’s almost worth clicking on it to find out what happens (but I simply cannot believe it would do a good job of summarising graphs?!?).
LikeLiked by 1 person
Thanks for pointing out that the Energy Institute is now partnered with climate propagandist Ember.
From their introductory text it is clear that the Energy Institute are pearl clutchers for the climate change hoax. One of their headline figures is that the world fossil fuel energy mix (2024) is 86% but their own detailed numbers show it to be 87%, rounded up from 86.6%. Some so-called “transition”!
The EI figure for the UK is 79%, still an unbridgeable chasm away from Net Zero. Whereas the world has increased its energy production year-on-year by 2.1%, the UK’s increase is a mere 0.2%. I’m surprised it hasn’t contracted with all the deindustrialisation that has been going on. I doubt if this dependency ratio will have changed much by the time of Miliband’s fabled “95% grid decarbonisation by 2030”.
LikeLiked by 3 people
There are other aspects to this. Global electricity production fuelled by coal fell for the first time, but as even Carbon Brief acknowledges, fossil fuel capacity for electricity generation continues to grow, especially in Asia, most notably in China and India:
https://www.carbonbrief.org/new-coal-plants-hit-10-year-global-high-in-2025-but-power-output-still-fell/
It’s also true that electricity is only part of the energy mix, a relatively small part at that, and that fossil fuel use continued to grow in 2025:
“Fossil Fuel CO2 Emissions Hit Record High in 2025”
https://www.ucdavis.edu/climate/blog/fossil-fuel-co2-emissions-hit-record-high-2025
The other thing to offer pause for thought is how much productive land is being taken out of productive use, all to achieve a tiny reduction in GHG emissions from electricity generation. And that assumes that Ember statistics, which are regularly spun heavily, can be accepted at face value.
LikeLiked by 1 person
Thanks JIT, for your analysis. And the introduction to the National Bureau of Statistics of China. 👍
For many years I used to get info on China’s energy use from the China Energy Portal >> https://chinaenergyportal.org/en/
Specifically, its dedicated page “(2021) electricity & other energy statistics (preliminary)”
https://chinaenergyportal.org/en/2021-electricity-other-energy-statistics-preliminary/
However, (2021) was, sadly, the last year it was updated.
From your NBS data (and applying your ½-year respective capacity-increase factors), China’s thermal plants generate at approx 48%CF, Wind at ~22%CF, and solar, as you show, at ~13%.
We get inundated with boasts of how much extra wind & solar capacity China adds annually; the propagandists never mention that Chinese thermal generates at over twice the CF of its wind and at treble the CF of its solar.
LikeLiked by 3 people
So, China added a Germany-sized grid last year… but…
“Analysis: China’s new carbon metric leaves Germany-sized gap in its emissions”
Thanks to Carbon Brief for totting this up. I saw this in the WSJ last week – no I don’t usually read it, but was on a long train ride. Jo Nova reminded me of it a couple of days ago.
–Carbon Brief
LikeLiked by 1 person
They’re all at it. UK targets are a lot easier to achieve if you ignore consumption emissions.
LikeLike