Historical Perspectives on Climate – The Super El Nino of 1876-78
In March 2016, a climate emergency was declared by Stefan Rahmstorf. Gavin Schmidt also tweeted:
The ’emergency’ related to the NASA GISS Feb temperature anomaly of 1.35C above 1951-80 baseline (which incorporates most of the mid 20th century cooling), variously described as ‘unprecedented’, ‘shocking’ and ‘jaw-dropping’ and the ‘hottest ever’ February on record. As we all know, it’s cooled a lot since. Nov 2018 anomaly in GISS is 0.77C. So, in just under 3 years, the planet has cooled 0.58C. Shocking! Even more shocking is that by June of 2016, the planet had cooled 0.59C – just 4 months later! That’s weather for you. What is obvious is that, despite people like Adam Scaife claiming the 2015/16 El Nino was just the ‘icing on the cake’ with regard to the record warm years of 2015 and 2016, that the ‘vast majority’ of that record-breaking warmth was due to GHG global warming, this claim simply does not hold up to scrutiny. El Nino bumped up the annual global mean surface temperature of these two years by approximately 0.2C. They stand head and shoulders above surrounding years, proof that it was weather which made them spectacularly warm, not climate change. El Nino also contributed hugely (about 0.6C) to the record warm February of 2016, when climate alarmists were publicly wetting their pants. In Hadcrut 4 data, 2015 is 0.76C above the baseline, 2016 annual anomaly is 0.78C, whereas 2018 anomaly is just 0.59C. Earth has evidently cooled off after a spectacular super El Nino.
There was a super El Nino in 1997/98 too, another in 1982/83. There was also a very spectacular and extremely disruptive El Nino in 1876/78 which doesn’t feature too much in climate alarmist reports, funnily enough. Can’t think why, though it might have something to do with the fact that there was virtually no fossil fuel derived CO2 in the atmosphere at that time. That’s just a guess of course but it goes without saying that there was nobody around at the time with the courage or effrontery to admonish the populace of Great Britain, the United States, Canada and other Western nations for causing global climate disruption via an addiction to the ‘in’ 4 x 4 transport of the time, i.e. carts drawn by horses with four hooves.
So, was the El Nino of 1876/78 special? Yes. Was it comparable to the very powerful El Ninos of 1997/98 and 2014/16? Yes. In some respects, 1876/78 was even more extraordinary than either of its modern counterparts and its effects on world weather and society were more widespread and devastating.
Deepti Singh authored an excellent article on the climatic upheaval associated with the 1876-78 El Nino which was published in Nov 2018. Of the period 1875-78, she says:
It is one of the worst humanitarian disasters in human history.
We find it’s the most severe event in the 800-year record in Asia.
This event was the strongest El Niño that has occurred since the 1850s. Sea surface temperatures remained high for 16 months. That makes it bigger than the huge El Niños of 1997-98 and 2015-16.
But that’s not all. In 1877 a second climate cycle, the Indian Ocean Dipole, was active – meaning the western Indian Ocean was warmer than the east. This typically weakens India’s monsoons. It was the strongest Indian Ocean Dipole on record.
The Atlantic Ocean was also unusually warm from 1877 to 1879. Following the El Niño, it peaked to the most extreme temperatures on record.
In other words, the period 1875-78 encapsulated a highly unusual, if not exceptional series of climatic events, which in all probability are linked, one to the other. It was the perfect climate storm and it could happen again.
The drought happened before greenhouse gas emissions had affected the climate. “That’s why it is a cause for concern,” says Singh. If it happened once, it could happen again, and we don’t know how often.
From the abstract of Singh’s paper:
From 1875 to 1878, concurrent multiyear droughts in Asia, Brazil, and Africa, referred to as the Great Drought, caused widespread crop failures, catalyzing the so-called Global Famine, which had fatalities exceeding 50 million people and long-lasting societal consequences. Observations, paleoclimate reconstructions, and climate model simulations are used 1) to demonstrate the severity and characterize the evolution of drought across different regions, and 2) to investigate the underlying mechanisms driving its multiyear persistence. Severe or record-setting droughts occurred on continents in both hemispheres and in multiple seasons, with the “Monsoon Asia” region being the hardest hit, experiencing the single most intense and the second most expansive drought in the last 800 years. The extreme severity, duration, and extent of this global event is associated with an extraordinary combination of preceding cool tropical Pacific conditions (1870–76), a record-breaking El Niño (1877–78), a record strong Indian Ocean dipole (1877), and record warm North Atlantic Ocean (1878) conditions.
It is surprising that such a momentous global event has been largely forgotten in these modern days of climate alarmism, where even moderate regional flooding or drought makes headline news as evidence of ‘climate change’ in action. It is perhaps not surprising that, amid the horrified superlatives uttered by astounded, amazed and deeply worried climate scientists at the height of the super El Nino 2014/16, not one managed to mention the even greater global climatic catastrophe which unfolded nearly 150 years earlier, centered around an arguably even more massive El Nino which spiked global temperature even more dramatically.
However, way back in 2007, some proper scientists in Chile were saying what their colleagues in 2016 were not:
At times when attention on climate issues is strongly focused on the assessment of potential impacts of future climate change due to the intensification of the planetary greenhouse effect, it is perhaps pertinent to look back and explore the consequences of past climate variability. In this article we examine a large disruption in global climate that occurred during 1877–1878, when human influence was negligible.
The mechanisms explaining this global disturbance are not well established, but there is considerable evidence that the major El Niño episode that started by the end of 1876 and peaked during the 1877–1878 boreal winter contributed significantly to it.
So Just How ‘Big’ Was the 1876/78 El Nino?
In terms of the spike in global temperatures at the time, here is a graph (with the long term trend removed) of the Oct-Mar temperature anomaly (ref. 1961-90). It is twice the magnitude of the spike generated by the next most powerful, the 97/98 El Nino. It’s debatable whether the Oct-Mar 2015/16 anomaly (not shown) came anywhere near that either. Something to check.

In terms of ocean temperature in the Nino 3.4 region, a study published in January 2017 using a new ocean dataset shows that it was even warmer in this important classification region in 1877-78 than in 1997-98, or 1982/83, meaning that a late 19th century El Nino was even more “super” than two much heralded late 20th century “super El Ninos”.
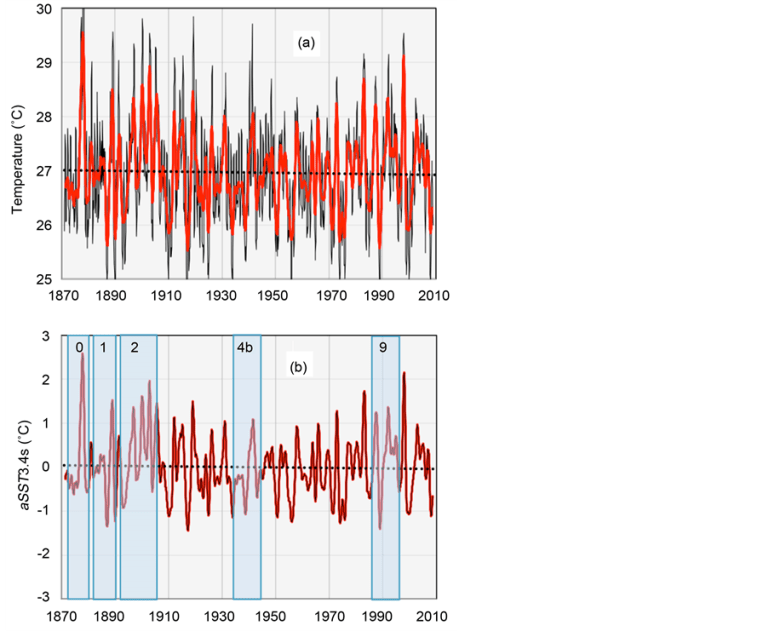
But what about El Nino 2015/16 (or 2014/16 as it is sometimes referred to)? In the recently created Ensemble Oceanic Nino Index (ENS ONI), which extends NASA’s ONI – beginning in 1950 – back to the 19th century, 1877-78 is pipped to the post (just) by the major El Nino of 2015-16. In many respects, the two super El Ninos are very comparable.
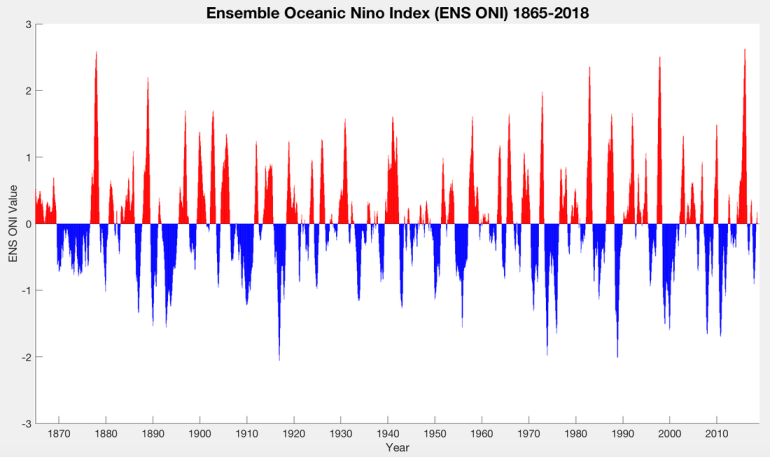
What is very obvious from the above chart is that, after the stunningly powerful El Nino of 1876-78, things gradually quietened down on the ENSO front, to a minimum in the early 20th century, rising only slowly into the mid 20th century, then taking off again after the 1976/77 Pacific climate transition, with a series of three very powerful El Ninos, culminating in 2015-16. The pattern of variation bears absolutely no resemblance whatsoever to the steady build up of GHGs in the atmosphere and looks more like a natural cycle.
The extended Multivariate ENSO Index ranks 1877-78 below 1982-83 and 1997-98:

Nevertheless, the authors of the 2011 paper say:
For the period of record that we investigated (1871–2005), the MEI.ext shows that many features of recent ENSO variability are not quite as unusual as sometimes claimed. The overall ENSO activity level of recent decades is comparable to the situation about a century ago, while the early‐ to mid‐20th‐century ‘slump’ in activity was the odd portion of the record. In terms of event spacing, the dearth of La Niña events from 1976 to 2005 is one of the features that stands out in the 135‐year record, but appears to have been superseded by more active La Niña behaviour since then.
Note however that a reanalysis of the extended multivariate ENSO index finds 1876-78 and 2014-16 to be comparable:
The 2014-16 El Nino event is very likely the first multi-year “Super” El Nino since at least 1876-78, hence little-no modern precedent for this event currently exists.
The ENS MEI.ext
• Likely provides the most realistic, up-to-date, significant, and longest running observationally-based measure of ENSO
• Increases the amplitude of most pre-1950 El Ninos
• Depicts 1876-78 as a very close analog to 2014-16
This puts into harsh perspective Gavin Schmidt’s March 2016 (t)witterings and Rahmstof’s and others’ shameless media hyping of a (nearly) unique recorded weather event as evidence of “shocking” global warming and an existential “climate crisis”. It also exposes the absurd claim that El Ninos are becoming more powerful and more frequent because of global warming and hence killing off the world’s coral reefs. There really is nothing much new under the climate sun.

A bookend to this is the unequaled cold event in North America in 1899. It also demonstrates, along with the history of such cold waves, that CO2 neither causes nor prevents these extremes.
https://rclutz.wordpress.com/2019/02/02/cold-waves-and-co2/
LikeLiked by 1 person
Yes Ron. Same principle. Climate alarmists need to show us the evidence that a modest secular warming trend since the late 19th century (most recently attributed in its entirety to GHGs by the IPCC SR15 report) has caused more extreme weather and/or worsened the effects of extreme weather events. As far as I can see, there is none.
LikeLike
Jaime,
Here are land temperatures calculated from GHCN-DAILY (30,000 stations). There is a clear temperature spike peaking at 1877/78 just before the Krakatoa eruption. CRUTEM4 is shown in green.
http://clivebest.com/blog/wp-admin/upload.php?item=8488
LikeLike
Here is the correct plot !
LikeLiked by 1 person
Thanks Clive. There is clearly a huge spike in global temperature which exceeds that of the later super El Ninos. That shows clearly on the Hadcrut 3 plot too.

LikeLike
A nice summary of what looks like a very credible study (though some of the many co-authors may object to their neglect), but sadly they couln’t help themselves at the end, where the paper descends into social justice commentary, such as this:
“Exacerbated by prevailing social conditions, famines followed the occurrence of severe droughts across the world (Davis 2001). In India, despite agricultural losses associated with the drought, British colonialists collected harsh taxes, hoarded and exported grain from India to England, and destroyed common resources that traditionally buffered societies from climate variability (Davis 2001; Meena 2015). Food shortages beginning in 1875 depleted local reserves, and high prices made food inaccessible to the starving local population, who were ultimately denied labor for being weak (Davis 2001).”
Another symptom of the sickness of modern climatology.
Another issue that will inevitably result in symptoms of sickness in the future can be seen in the statement that the GHCN rainfall data used mostly ends in 1997. There is indeed a shocking dearth of rainfall data in GHCN in recent decades, meaning that 19th century droughts are much easier to analyse than 21st century ones!
LikeLike
Climanrecon,
Much as I share your distaste for social justice commentary, I think the point the author was making is that the widespread famine of the time was greatly exacerbated by the prevailing socio-political conditions and it is hard to argue that this is not the case.
The severe and widespread 1876–78 drought in multiple grain-producing regions of the world was induced by natural SST variability. Therefore, such a global-scale event might happen again. With the projected intensification of El Niño–induced hydroclimate anomalies due to rising greenhouse gas concentrations and global warming (Seager et al. 2012; Cai et al. 2014), such widespread droughts could become even more severe. While the sociopolitical factors that translated the Great Drought into unprecedented famine (Davis 2001) do not exist in the current world, such extreme events would still lead to severe shocks to the global food system with local food insecurity in vulnerable countries potentially amplified by today’s highly connected global food trade network.
The author makes a valid point but can’t resist indulging in a spot of global warming apocalypticism. Then they come up with this absurd statement:
In a very real sense, the El Niño and climate events of 1876–78 helped create the global inequalities that would later be characterized as “first world” and “third world.”
Sadly, left wing concepts of social justice find their way into almost every area of mainstream academia these days.
LikeLike
Obviously absurd, the English managed the famine in Ireland, 20 years earlier, in much the same way.
LikeLike
Yep, well that’s bloody liberals for you. Full of fine ideas, but totally useless in government.
LikeLike
Clive
‘GHCN-DAILY (30,000 stations)
Nice. Good job going to one of the UR sources of data.
I am amused to note that everyone gives great credence to records prior to 1900..
when there were…. ‘no stations”
That is, on tuesday any given skeptic will tell you there are not enough stations in the early record to say anything. blah balh blah Nyquist .. b
On Thursday they will point to a record temperature event from that same time period as evidence of ‘somthing”
On Friday, they will complain about the lack or error bars or too many digits of precision. blah blah
Pat Frank… blah blah..
on sunday they will plot a chart ( which places a line with very high precision) and they will attach no
error bars. They do this when they like the story it tells.
not you, but some other guys.
LikeLike
Steve,
Well I have to check whether Berkeley are doing their job properly !
I presume you agree that the pre-industrial era was warmer than we thought ?
It is still perfectly reasonable to question how much an ever changing coverage affects global temperature anomalies (differences) with respect to some 30 year ‘normal’.
LikeLike
Hmmmm…
Such boldness at an obscure skeptical blog.
How’s it going to be so bold at the big consensus blogs, or at Tamino, etc…..
LikeLiked by 1 person
Tallbloke has picked up on an interesting paper on rainfall in Eastern Australia, with a record constructed going back 7700 years. It appears that strong orbital forcing constrained variability in ENSO activity up until the mid-Holocene, whereafter centennial-scale variability became more dominant, perhaps driven by changes in solar variability.
https://tallbloke.wordpress.com/2019/02/16/study-how-the-little-ice-age-impacted-parts-of-australia/
LikeLike