I don’t know why I bother. (Yes, that is inviting snark from you, Dear Reader.)
When the statistics for the UK’s carbon footprint were updated recently (now with data up to 2023!) I naturally thought I should revisit them and place an update here. In sum, my thesis so far has been that the UK’s Net Zero project, as well as being quite mad, is also an enormous fraud. It only counts territorial emissions, those produced within the UK. Since a post-industrial “service” economy exports ideas and imports material things, our real footprint includes a large quantity of emissions that are recorded on someone else’s books. It results in a situation where, in theory, we could still have exactly the same carbon footprint as we do today, even on the day when the champagne corks are popping to celebrate the UK having reached the sunlit uplands of Net Zero.
As time goes by, an increasing share of our emissions have been imported, and at my last update, I said that more than 50% of our carbon footprint now arises overseas; more than half of it does not even exist, as far as Net Zero is concerned. This is, of course, madness, and in any other realm, it would be cheating.
Simple as the sums may be, they can still be perplexing. To summarise,
Territorial = UK production = Net Zero yardstick
Consumption = UK production – exports + imports = real impact of UK on the atmosphere
When exports and imports of goods were about the same, Territorial and Consumption emissions were also about the same. Now that imports are much larger than exports, there is a wide gap between Territorial and Consumption emissions.
When I last wrote, in June, only data up to 2022 were available. On the last day of June, the data for 2023 were released. Time for an update, your author thought. Just add a single figure to the bottom of each column, and…
…except as I have noted before, older numbers are often subject to revision. This is no bad thing, of course. But when the new numbers for old years don’t match what I have in my spreadsheet, I immediately second-guess myself and wonder whether I have perhaps accidentally mangled things. On this occasion, the differences were large enough that I even went back and downloaded old, but pristine spreadsheets from the source, just to check.
Well, I needn’t have bothered. My numbers were correct. Anyway, more on the revisions later. What about the update? How fake is our journey to Net Zero this year?
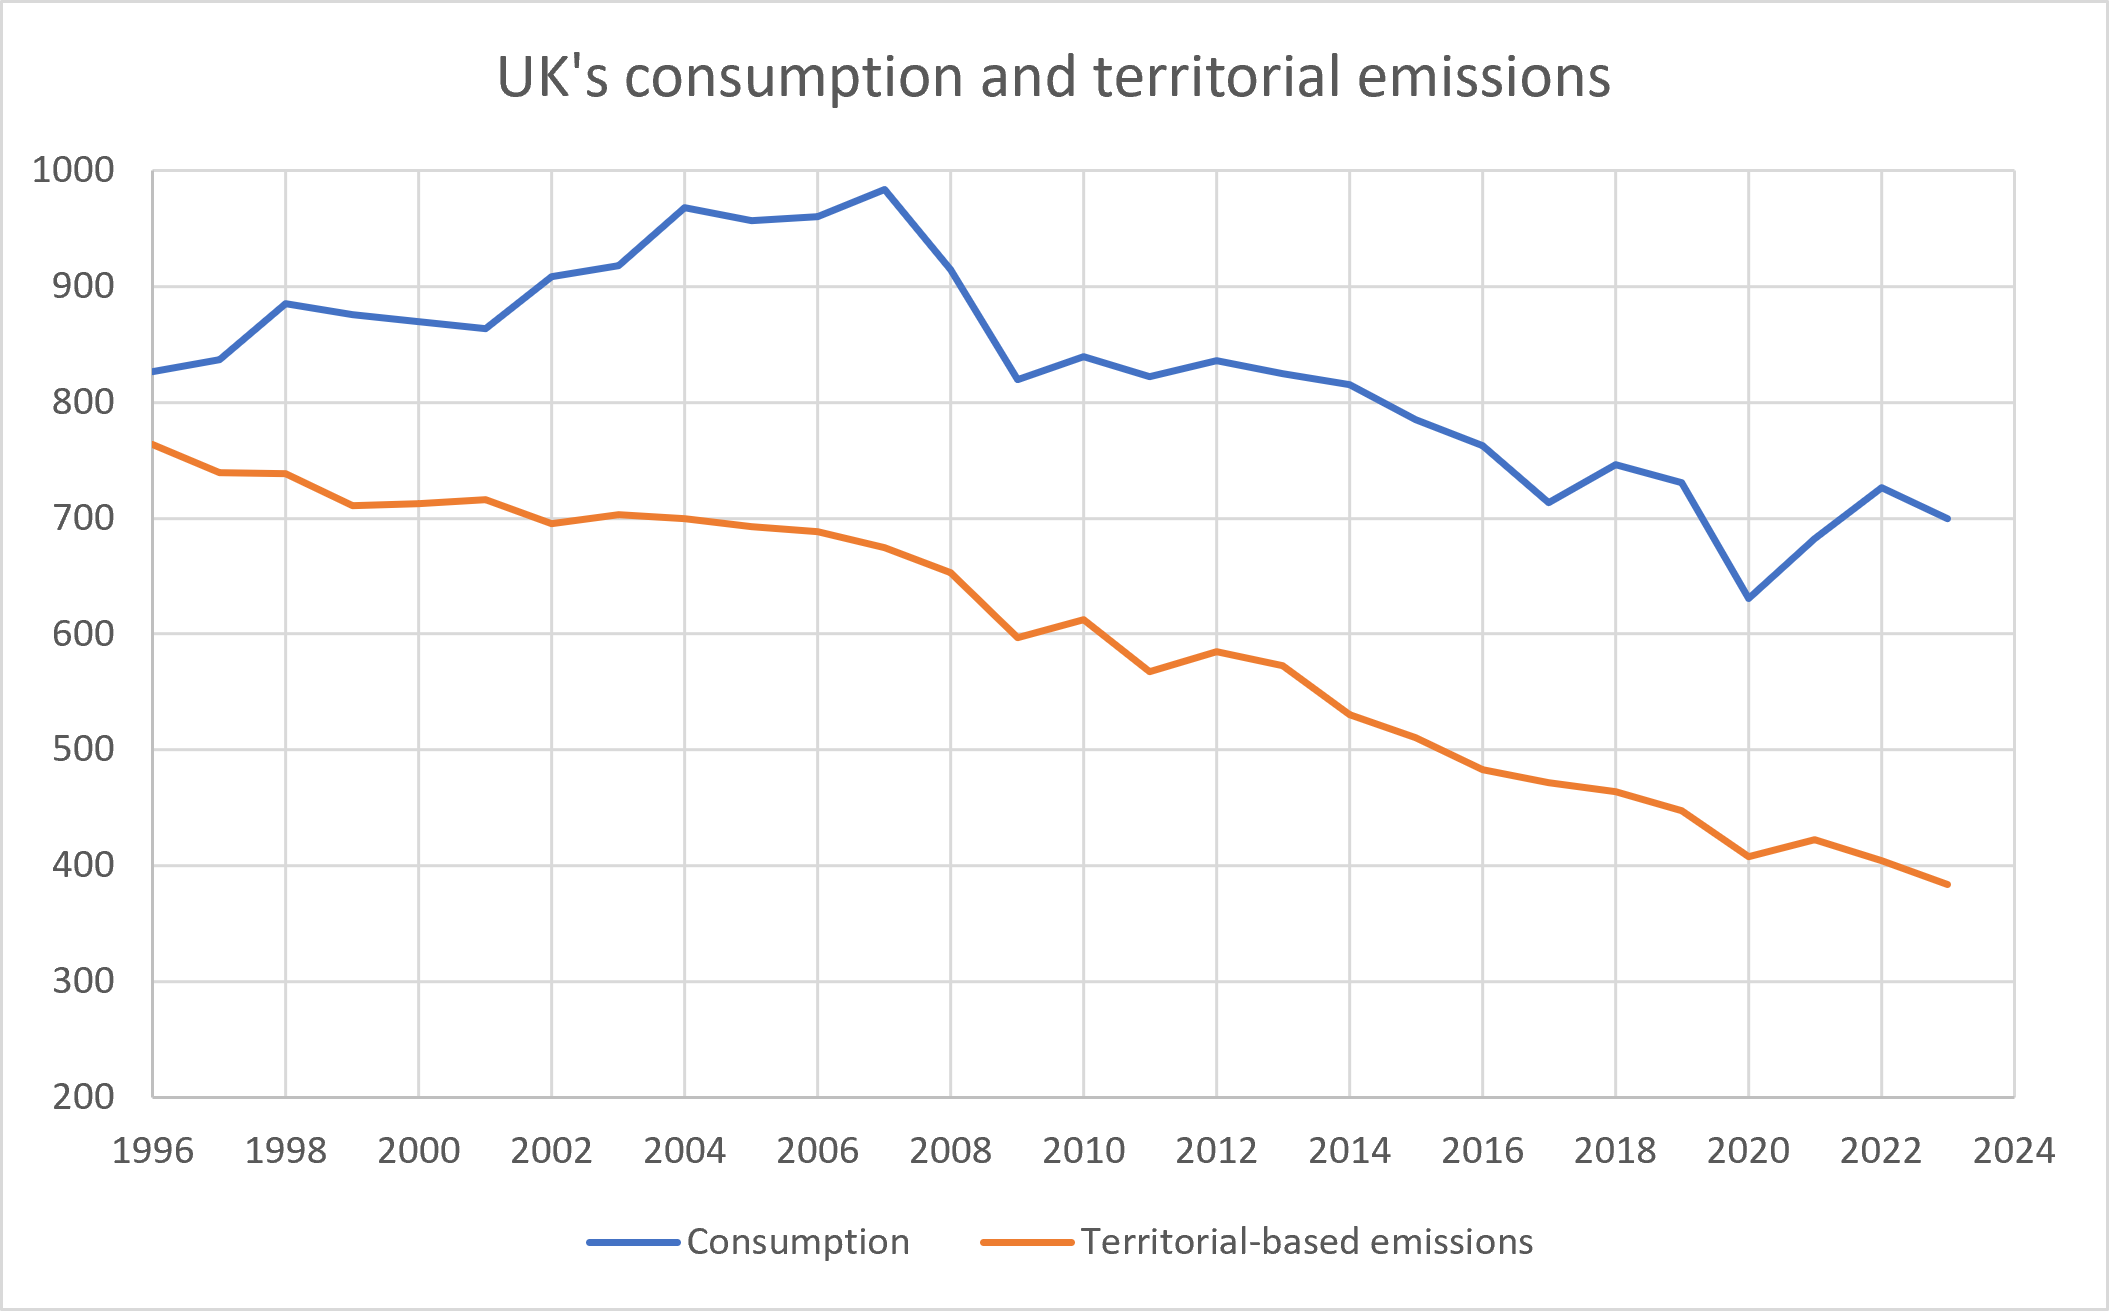
The UK’s consumption (the important thing for “teh climate”) was 699 Mt CO2eq.
Our territorial emissions (the important thing for “teh Net Zero”) were 384 Mt CO2eq.
Bear in mind that this latter number includes our exports (-56 Mt).
Imports, at 371 Mt, are more than half of consumption (699 Mt). However, the ratio of the two has gone down a little this time. Exports have gone down, but imports have gone down faster.
What about those revisions?
Well, this is why I threw my hands up earlier and wondered about the point of existence, or at least, the point of trying to draw sense out of these periodically-updated statistics. Every number in the series (going back to 1996) has been subject to some sort of revision. Not just last year –even 1996 has been revised. Mostly, estimates of imported emissions have gone up, and consequentially, so have estimates of overall consumption. Between the 2024 and 2025 update, the team at Leeds managed to find 79 Mt of extra imports of greenhouse gas emissions for the year 2016. I know I’m often losing 79 Mt down the side of the sofa: aren’t you? [30 Mt of this was subsequently lost with the 2026 update. See figures below.]
2016 imports of GHG (2024 est): 320 Mt
2016 imports of GHG (2025 est): 399 Mt
2016 imports of GHG (2026 est): 366 Mt
The net of the most recent annual revision is shown in the figure below, in terms of its effect on the overall estimate of consumption. The numbers range from +29 Mt to -37 Mt.
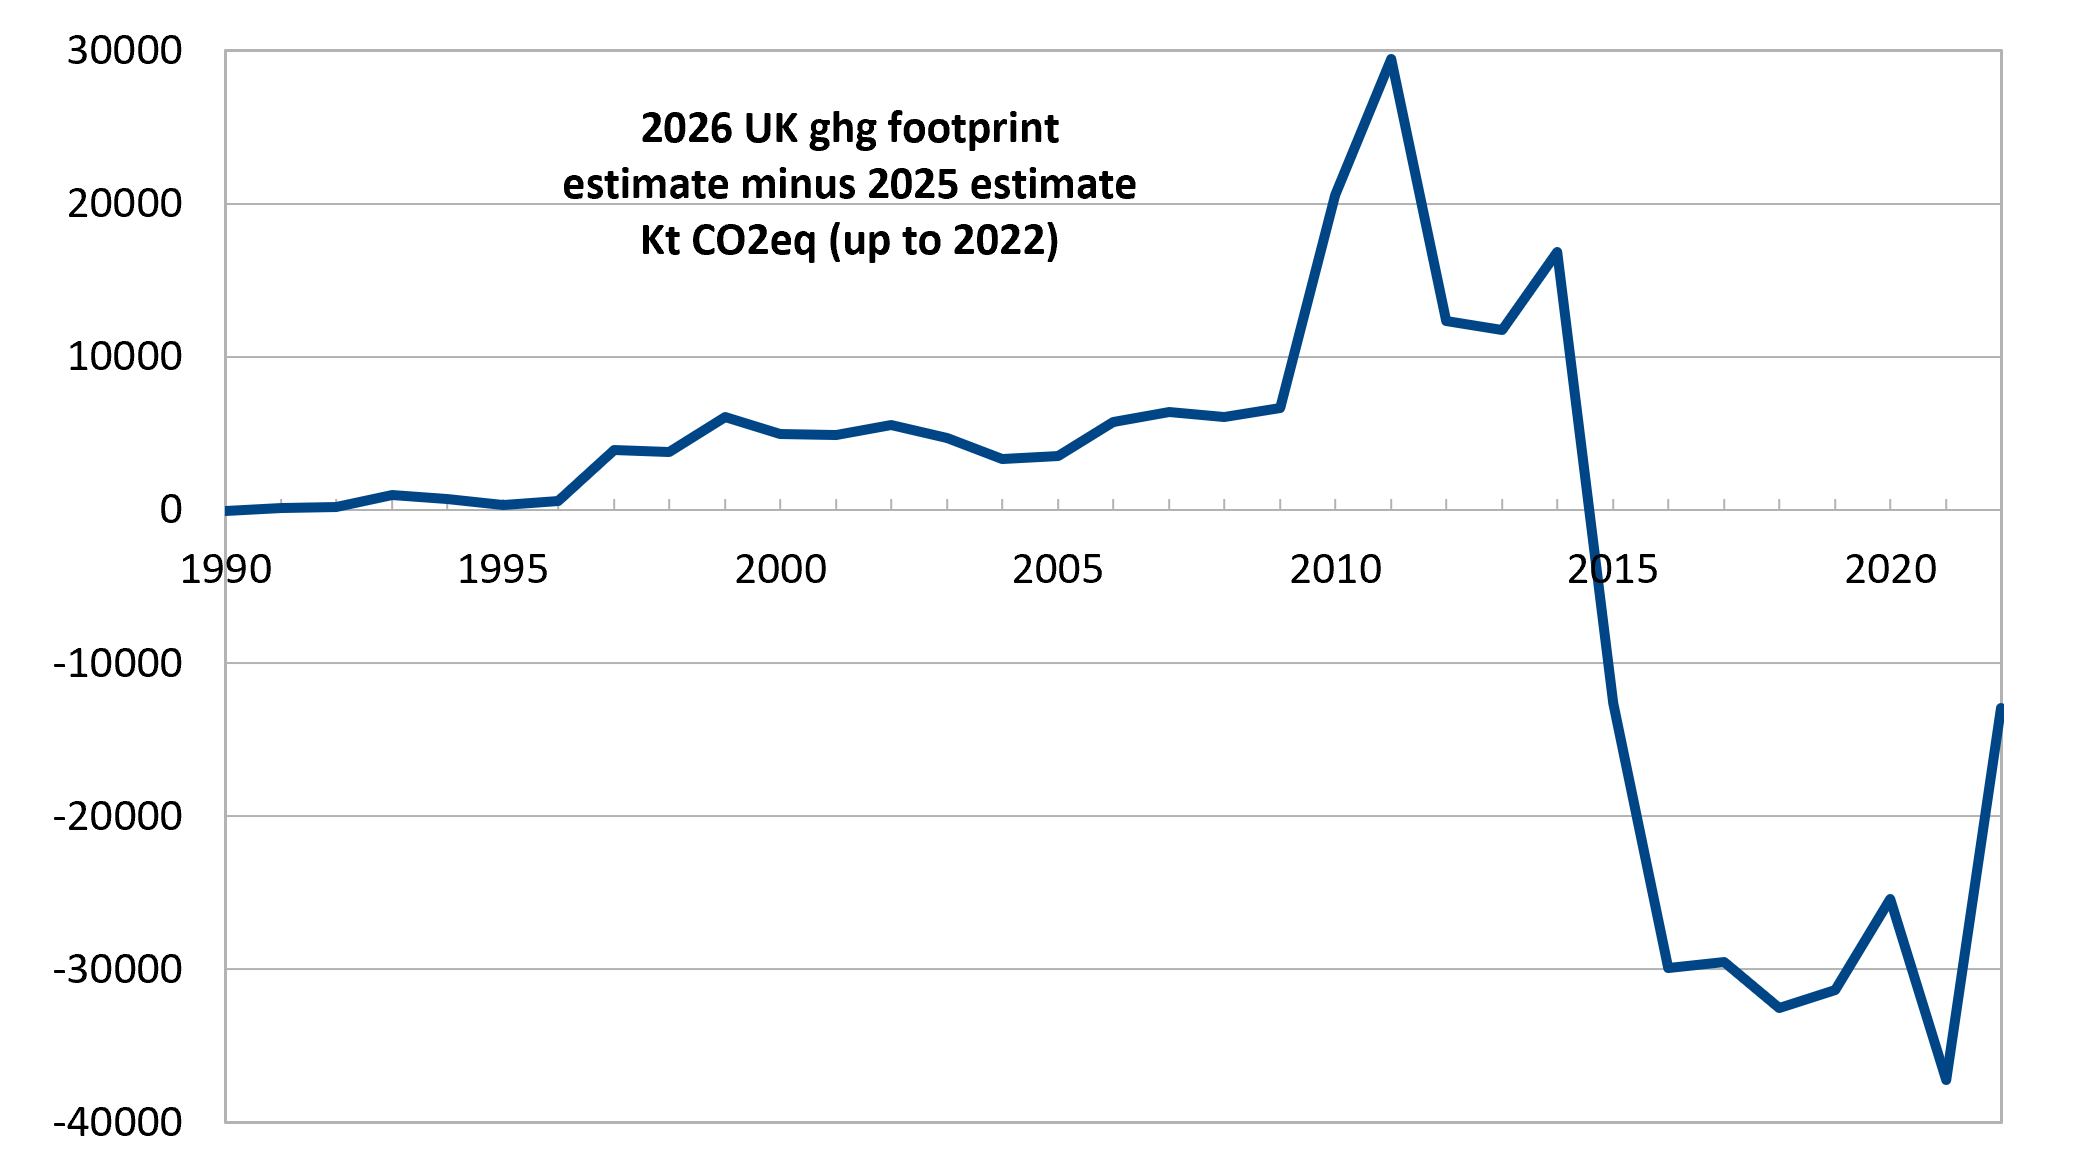
Let me squelch the thought that there is some nefariousness here. There is not. Leeds are revising the numbers to their best estimate. But, and it’s a big but, if 79 Mt can just appear after a decade…
…what is the point of comparing the data every time a new year’s worth is released? That being the case, I do not propose to continue this exercise next year.
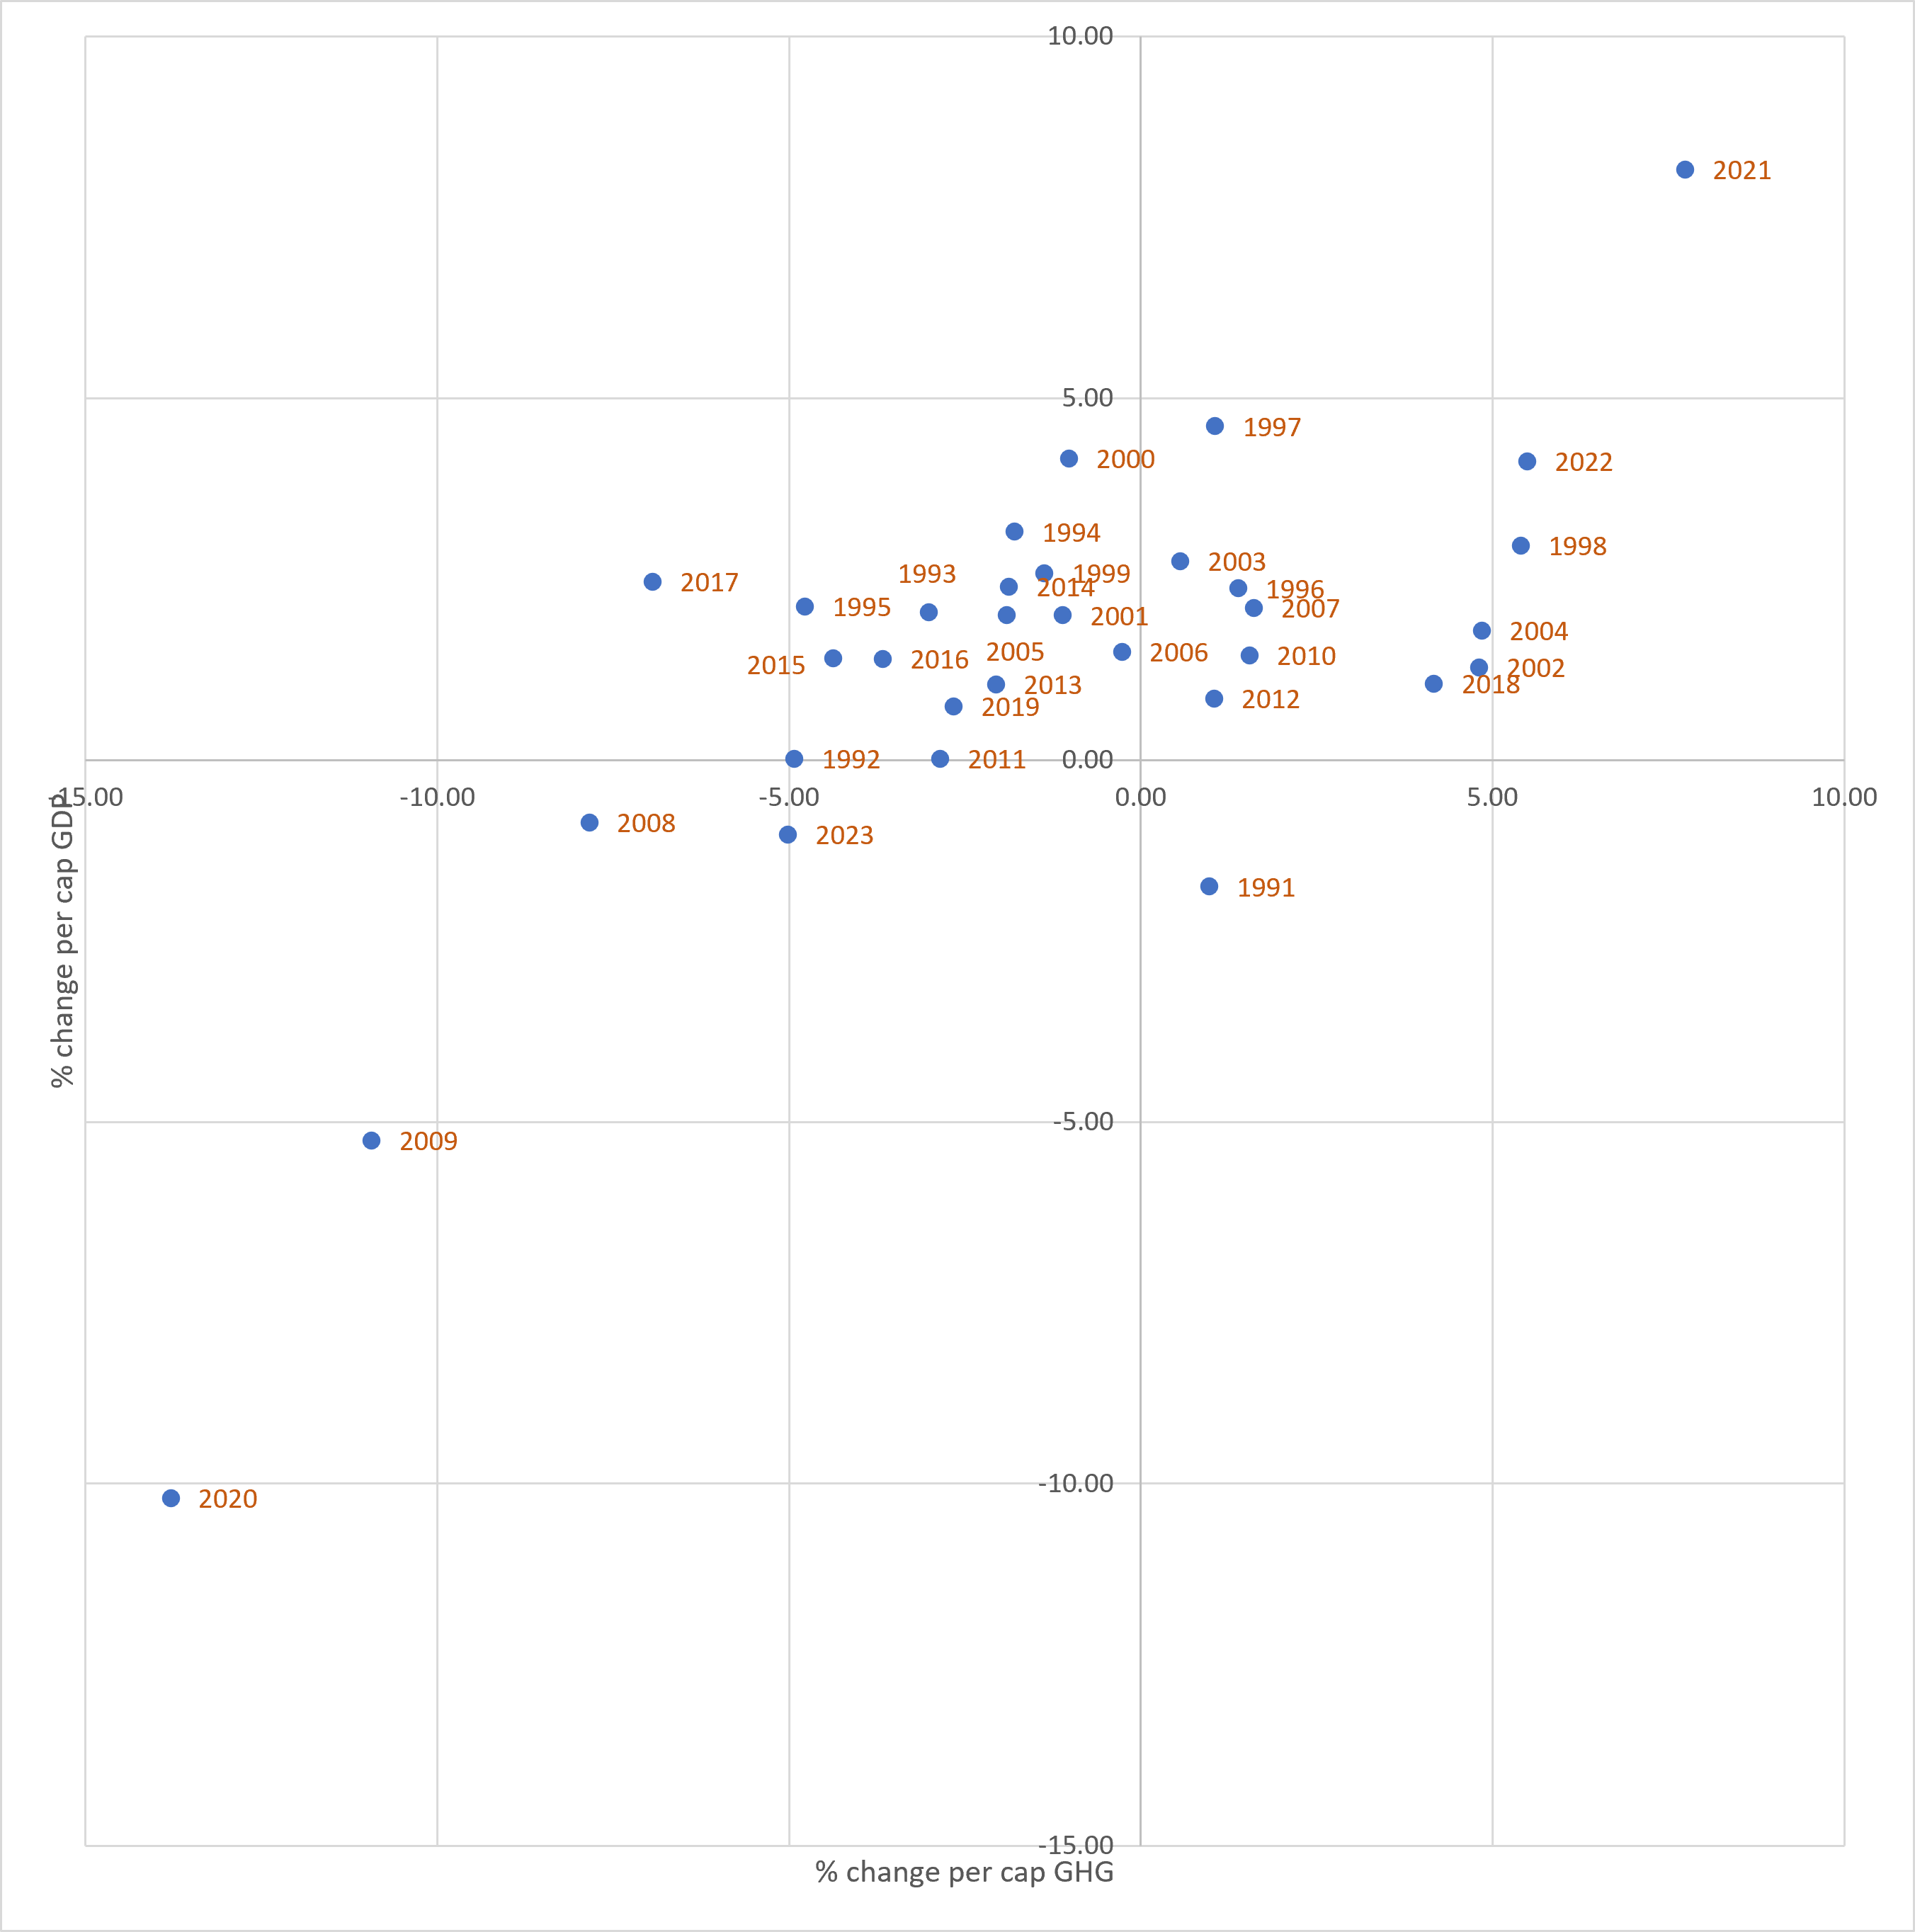
I have also plotted here annual per-capita GDP and per-capita GHG changes for the UK, as % on both axes. I won’t say one variable is against the other, since I would be hard pressed to draw an arrow of causation here. Most of the years are labelled, and you can see the plunge and recovery of Covid, and the plunge and non-recovery of the financial crisis. The line is heavily steered by these outliers. I would say that typically the UK has a low rate of growth regardless of that year’s GHG emissions changes. It’s just that in recessions, or post-recession booms, money and GHGs go up and down in sync.
In the Upside Down
It occurred to me today that we are living in an upside-down world, where impossible things are easy (Net Zero, notwithstanding moving half of the accounts off book), and easy things are impossible (keeping violent prisoners in jail for the duration of their term, or preventing giant rubber dinghies from crossing the Channel).
It’s a funny old world where a new PM comes into office, determined to bend the rainbow to his will, and immediately discovers that an easy thing that everyone wants done…
…is impossible.
 Climate Scepticism
THE STORY OF THE BRITISH ENERGY CRISIS OVER 20 YEARS OF INSANITY
https://thecritic.co.uk/british-energy-planning-a-horror-story/
One reason for the crisis is that lower domestic emissions by offshoring them to other countries and the short term success of this policy came at the price of running down local industries and dramatically increasing the price of power.
IN THE BIG PICTURE, CONSIDER THE DISASTER OF THE NET ZERO PROGRAM.
IS THERE A MORE DISASTROUS PUBLIC POLICY BLUNDER ON RECORD?
What comes second?
Wind and solar capacity is not real capacity because it’s not available on windless nights.
https://rafechampion.substack.com/p/wind-and-solar-aint-capacity
Batteries are not the answer. Just ask Bill Gates😊
2 MINUTES https://youtu.be/VjgDvG13Hgs
Besides, wind and solar don’t generate enough energy to reproduce themselves. That means they are a net drain on the energy economy of the world.
https://rafechampion.substack.com/p/wind-and-solar-are-parasites-on-the
IT WAS SO EASY TO AVOID, BY DUE DILIGENCE ON THE RELIABILITY OF THE INPUTS TO THE WIND AND SOLAR FACTORIES.
https://rafechampion.substack.com/p/criminal-failure-of-due-diligence
WHAT IS THE COST/BENEFIT RATIO OF NET ZERO?
How much has net zero cost up to date, including the cost of the programs and the damage?
What are the benefits?
In other words, how much would you like to pay to get more expensive electricity looming blackouts in catastrophic environmental damage?
https://rafechampion.substack.com/p/how-much-would-you-be-prepared-to
THE BEAUTIFUL BENEFITS OF WARMING AND CO2
Throughout recorded history, the warm times have been the good times. In the coldest times, life was truly nasty, brutish and short.
The warming since the Little Ice Age has been unequivocally beneficial and we are still a degree or three short of the Roman Warm Period which was the best time for humans and other living things.
If we are lucky, we might get two or three degrees of warming before we turn the corner and start the downhill run into the next cold spell.
Fear of warming and plant food is driving the greatest misallocation of resources ever, with trillions of dollars worldwide, wasted on the failing transition to wind and solar power.
Trillions have been spent on the worldwide net zero crusade and we have got more expensive power, with blackouts looming and ongoing wreckage of forests and farmlands.
LikeLiked by 3 people
Please do keep checking the GHG figures. After all, this is why we pay through the nose to vandalise Britain’s countryside.
A graph of total GHGs would help and one of total GHGs per capita.
LikeLiked by 1 person
For some reason the UK government recently came clean and atoned for their past misinformation by issuing a gov.uk update (includes a handy graph) which admits that from 1996 to 2023, UK net greenhouse gas emissions fell just 15%. A measly 15% reduction, after 27 years of despoiling our landscapes and seascapes and degrading our electricity grid with expensive, weather-dependent, difficult to integrate, instability-inducing and unsustainable windmills and solar panels which have to be expensively duplicated by conventional power stations to keep the lights on!
To quote Paul Homewood from his recent post on the solar eclipse, “Nobody gives a toss about carbon emissions”!
LikeLiked by 1 person
Rafe Champion: That’s a great interview of Bill Gates talking sense for a change, surprisingly seven years old. I’ve just posted a comment (under a David Turver post) relating to Net Zero on Gates and the finance hotshots (Larry Fink and Chris Hohn in a follow-up comment) who seem to think they can spreadsheet their way Net Zero. It’s quite a long comment in which I fumble towards trying to figure out what the heck Net Zero is really all about.
LikeLiked by 1 person
I’ve just watched the BBC’s News at 6, something I rarely do. The first 5 minutes was devoted to bewailing the high temperatures afflicting England (but not Scotland), with the unstated subtext that this is happening because of man-made CO2 global warming. It’s all so tiresome!
Discounting the fact that the high temperatures are exaggerated by the corrupt Met Office’s junk science weather stations, these charlatans must know that honest science has proved that rising atmospheric CO2 levels (overwhelmingly natural, not anthropogenic) have negligible impact on the global climate and, more importantly, that the global consumption of fossil fuels and therefore CO2 emissions continues its long-term year-on-year increase, meaning that economy-wrecking unilateral UK Net Zero is pointless.
LikeLiked by 1 person
Jit,
I too would welcome annual updates. You may worry that it’s a waste of time, but there are some extremely serious issues here: if we can’t work out with any accuracy what the UK’s emissions are, whether territorial or imported, then it suggests net zero is a farce.
If we can’t measure with any confidence as to accuracy the emissions of other countries, then the COP process is even more of a farce than appears to be the case at face value: https://cliscep.com/2021/03/28/how-do-you-measure-hot-air/
If we can’t with any confidence work out with real accuracy the greenhouse gas emissions fully associated with renewables energy projects, why do we talk so blithely about “clean, green energy”, especially given its negative environmental impact aside from GHG emissions:
The whole project is a fool’s errand, and we are the fools who are paying for it.
LikeLiked by 1 person
Mark Hodgson: “… then it suggests net zero is a farce”. Wake up to unilateral UK Net Zero reality!
LikeLike
Jit – thanks for another dive into the dark & murky waters of UK’s carbon footprint.
@dougbrodie1 – when you say – “I’ve just watched the BBC’s News at 6, something I rarely do. The first 5 minutes was devoted to bewailing the high temperatures afflicting England (but not Scotland), with the unstated subtext that this is happening because of man-made CO2 global warming. It’s all so tiresome!”.
I’m not sure we watch the same BBC news, because there is no “unstated subtext” as I recall, they constantly link heat, fires, drought, extreme weather off any kind to MMGW or whatever It’s called lately. 1pm news had Jim Dale on giving his balanced view on UK/Europe’s hot summer – Jim N R Dale: Senior Meteorologist – Meteored UK
LikeLike
Mark, you wrote, “why do we talk so blithely about “clean, green energy”, especially given its negative environmental impact …” Yes, why indeed!
Here is professor Helm (https://dieterhelm.co.uk/energy-climate/the-cost-of-energy-and-what-to-do-about-it/) on 2nd June, “In this context, it is worth also debunking the idea that the energy world is divided simplistically into “clean” and “dirty” energy, and that renewables in particular are “clean”. They are not. The supply chains are full of emissions and pollution – from mining to transport to refining to manufacture of the generation equipment and the transmission and distribution systems, and batteries can be very dirty. Take a look at the lithium, cobalt, nickel and copper and rare earth mines around the world. Renewables may be “cleaner” (although not always), but they are not clean and they are not zero emissions. Decarbonising the world’s energy systems is a much harder task than advocates of the simplistic notion of “clean energy” apparently believe.”
Regards, John C.
LikeLiked by 1 person
editorl, you ask for a figure of GHG per cap. The data are provided at the same page as that in the main post, which I ought to have linked to before. The figure looks like this:
The figure for 2023 was (is) 10.2 t CO2eq/cap. (Implying a UK population of 68.5 million.)
Meanwhile, if you go to EDGAR, there you can see the average per capita GHG for the world, which for 2023 was 6.54 t CO2eq/cap.
The UK, on these numbers, is still living beyond its means. But, if you only consider the Net Zero-compliant territorial emissions, rather than the consumption emissions, we’re below the global average, at 5.6 t CO2eq/cap. Much of our consumption appears in the territorial emissions of countries like China.
LikeLiked by 1 person