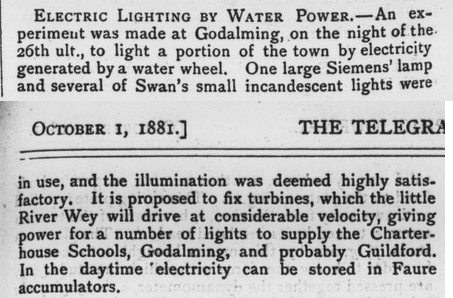
Reading Wiki, I find that the 1882 Holborn Viaduct power station, (DC) was not the first public power station in the UK, which actually was installed in Godalming a year earlier. The snip below (and the one below that) comes from The Telegraphic Journal and Electrical Review for October 1, 1881.
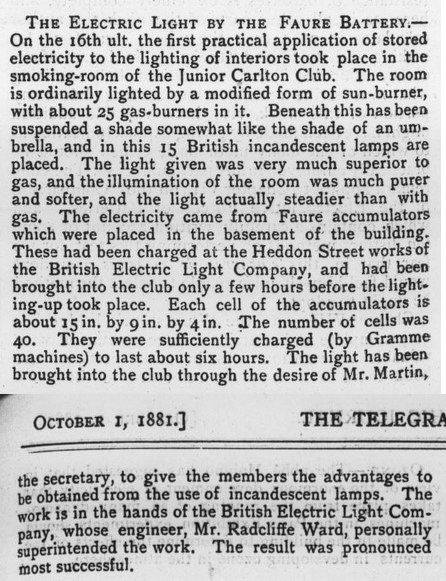
Faure accumulators were the original Powerwall it seems (I note that householders are to be offered power banks at a discount, or free. As exciting as a free thing may be, someone else is paying for it. It is in fact demanding money with menaces, and then giving it to someone else (no doubt very deserving…). Naturally, some of these units will ignite. I won’t be having one).
Why is Jit going down a whimsical road to the Victorian Era, you may wonder? Well, I was interested to know what our grid was like in bygone days. Of course, the first occasion that electricity was supplied to the public was not the first day that the UK had a grid. If you pull up this page on Archive.org you can find a span of old issues of “Statistical Abstract for the United Kingdom” going from the middle of the 19th century through to ten years ago (for the “Annual Abstract of Statistics” that it morphed into). One set of data that is reported there relates to electricity supply.
Not long ago, I gave a figure that showed the UK grid’s capacity factor declining as more intermittent renewables were connected. I said the capacity factor peaked in 2003 at about 0.58, and had declined by 2024 to 0.31. Well, my version of the capacity factor is not the one in current use. I took as the theoretical maximum energy that could have been provided the installed capacity times the hours in a year. The done thing seems to be to call the maximum energy provided the peak power actually provided times the hours in a year. Anyway, I’m sticking with my version, because the other does not account for a potentially infinite attachment of unused generators.
Although the first provision of public electricity began in 1881, the Statistical Abstract for the United Kingdom did not start reporting on this topic until the 1920s. Here’s a snip of early data:
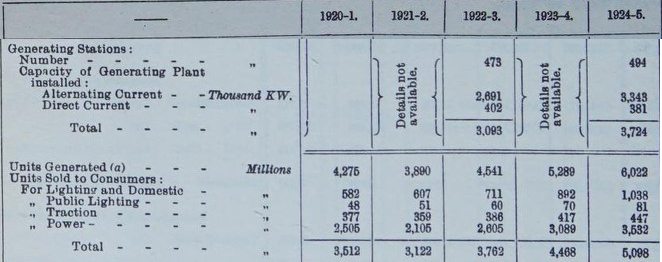
In 1922-3, 3 GW was installed, and of interest may be that more than ten percent of it was DC. The lines below the capacity show the destination of the generated energy. The statistics shown change over time: later editions show “Units sent out.” At the beginning, when this is not available, I’ve used “Units Sold” to calculate the capacity factor. So, without further ado, here is a new calculation for the capacity factor of the UK “grid” from the 1920s until now, a span of a century:
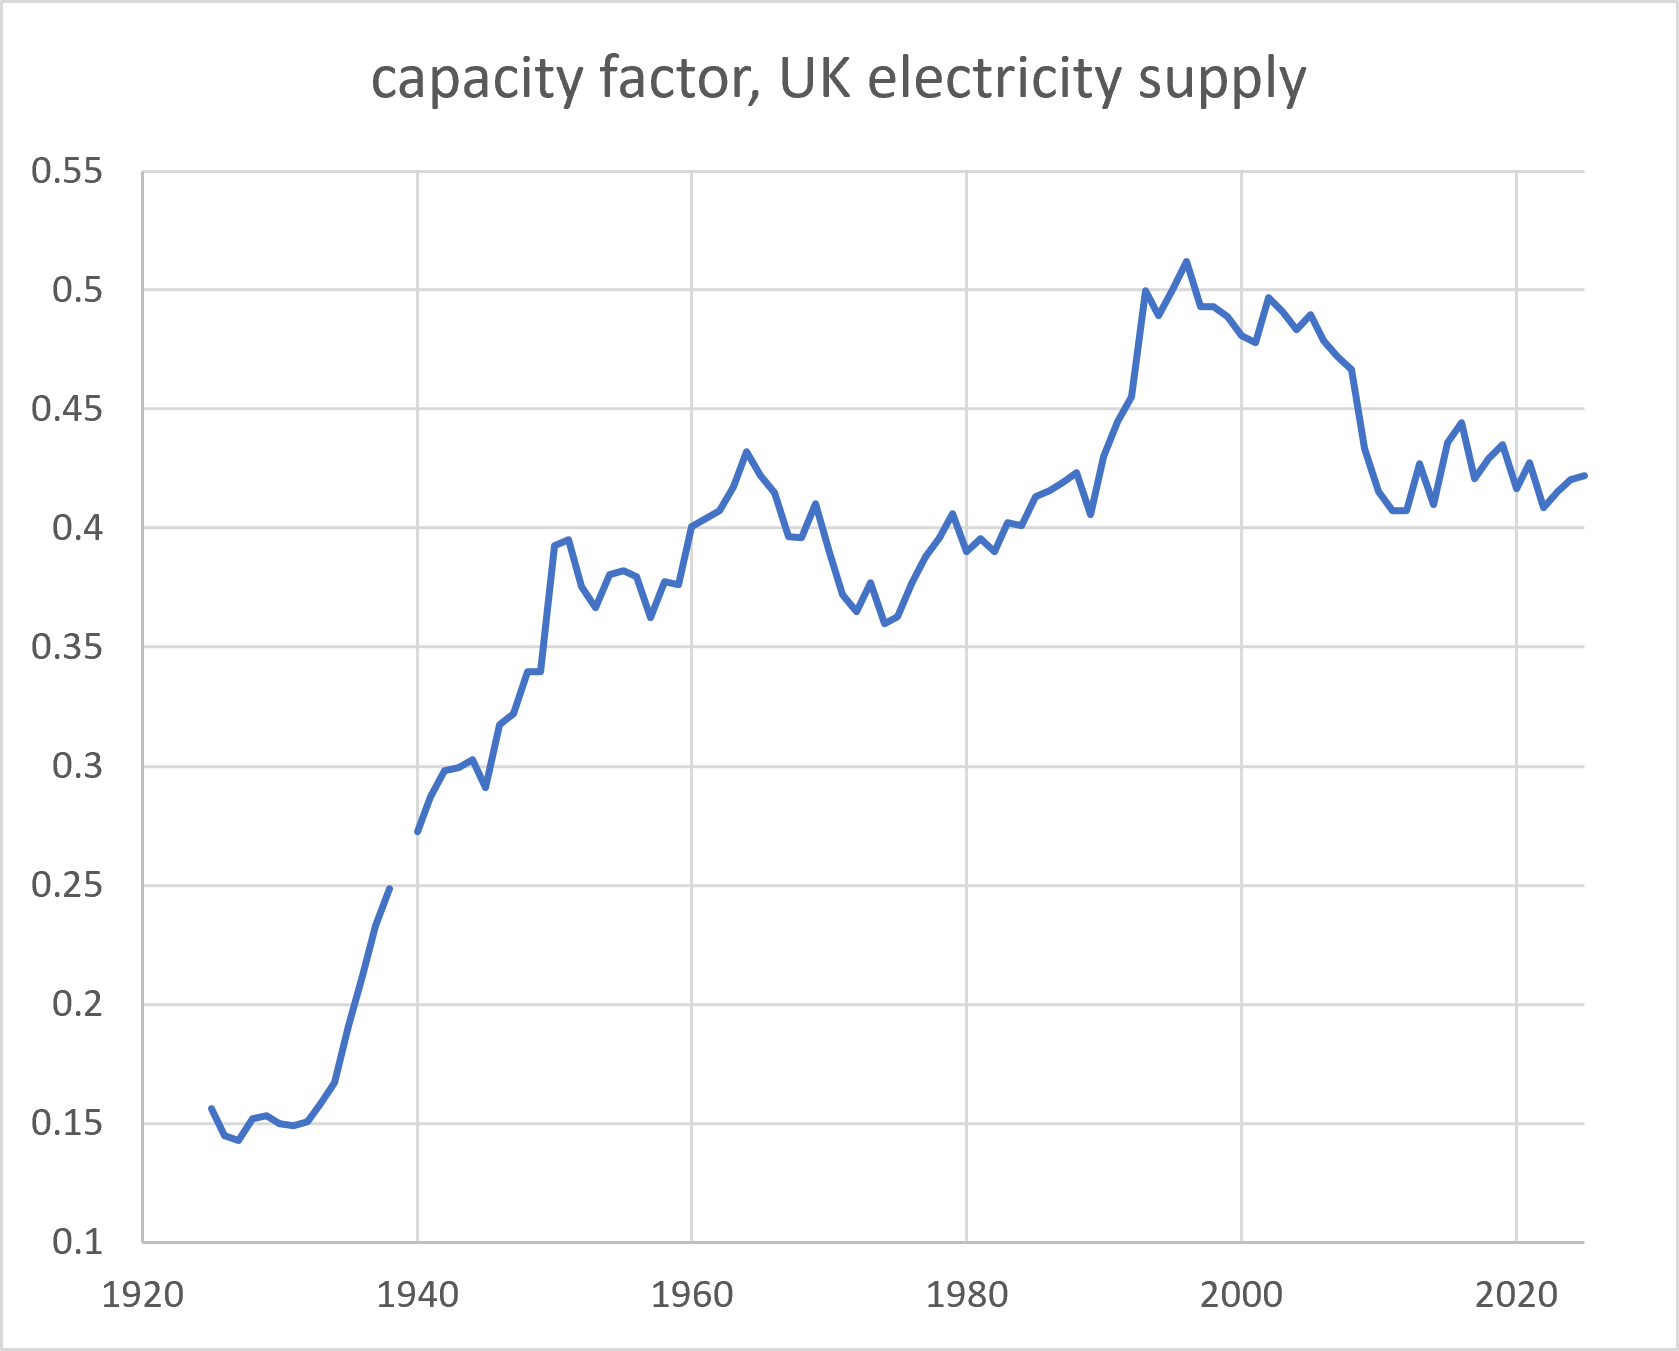
Well, that doesn’t look too bad. We’ve kind of plateaued, not plunged. The appearance of the grid is slightly flattered because from 1998, I took the values for installed capacity from DUKES. DUKES reports generating capacity in de-rated quantities (as specified in the Electricity Act, 1989) for renewables. Renewables generally underperform even their de-rated capacities, but the situation looks far more dramatic if, as I have done below, their nameplate capacities are used instead (valid, I believe, since this represents their potential supply to the grid, at a (for them) perfect instant).
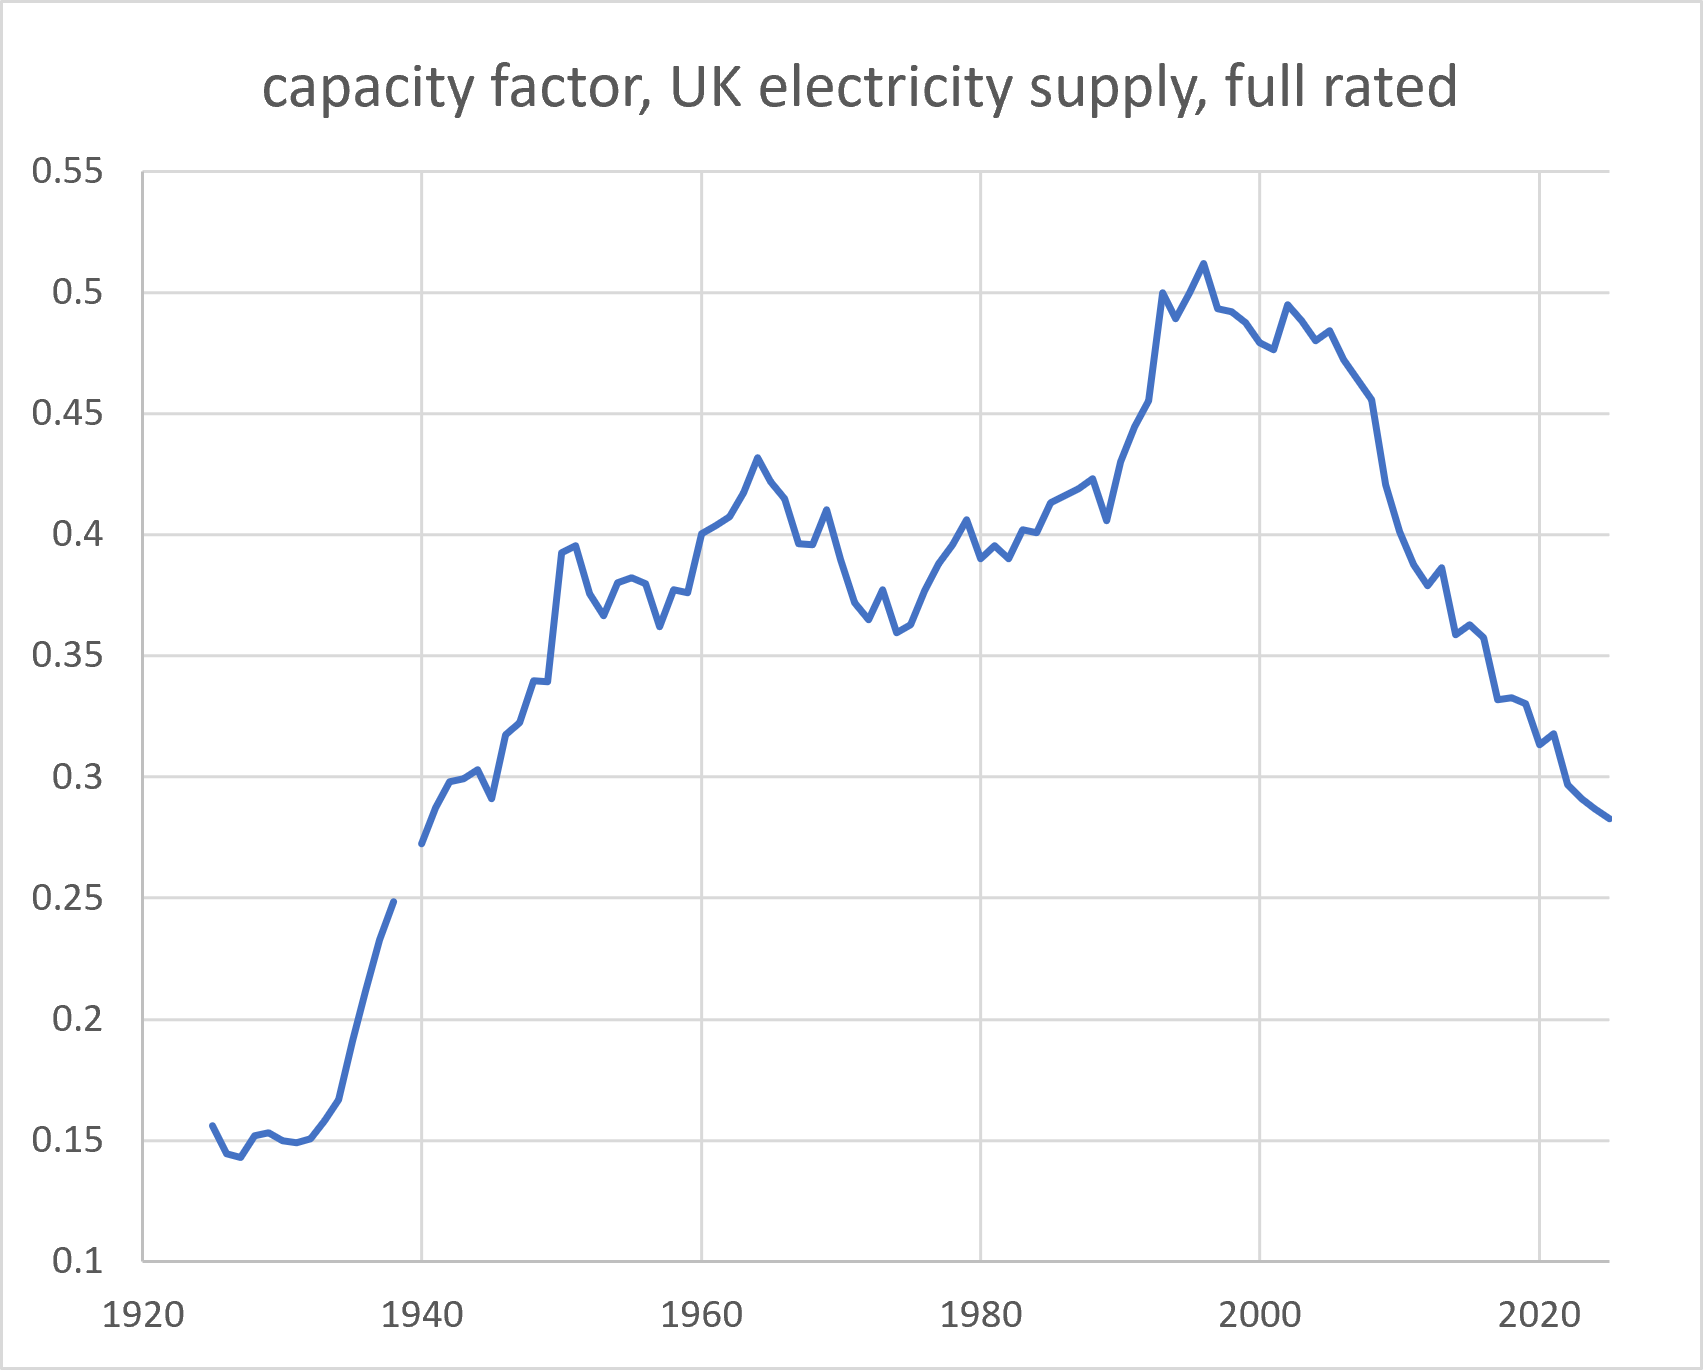
OK, so now the decline is rather more cliffy. The calculated capacity factor for 2025 is 0.28. How far back in time do you have to go to reach a UK grid that was equally – shall we say – peaky? Well, on these numbers, we have now dipped to a worse capacity factor than the grid provided in…
…1941.
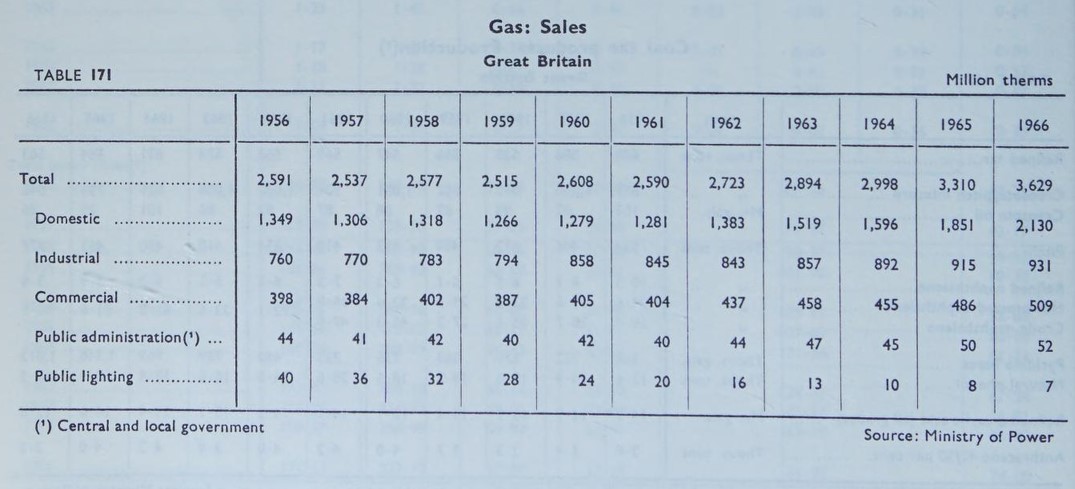
I would say /message ends here, but there are another couple of interesting factoids I wanted to show you before I leave. The first snip shows gas still in use for public lighting, at a date that some of us (not the present author…) may remember.
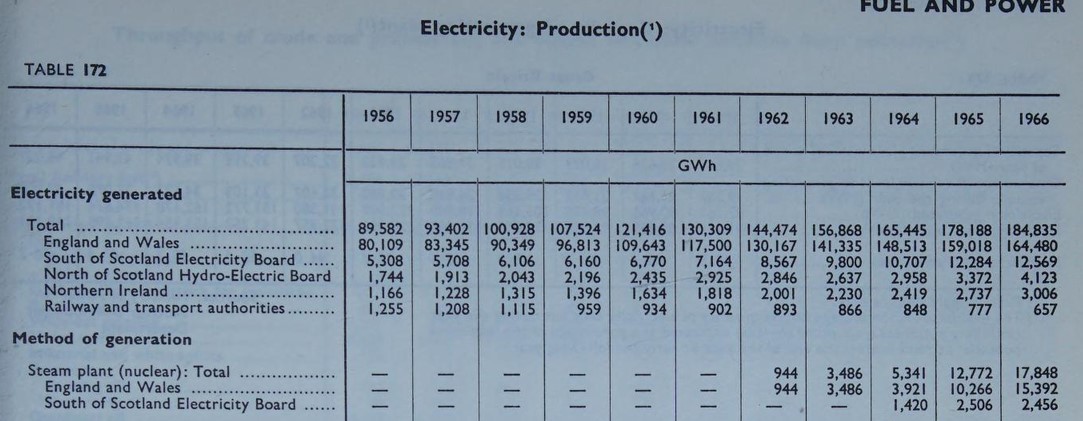
The second shows the beginnings of nuclear on the grid, from 1962:
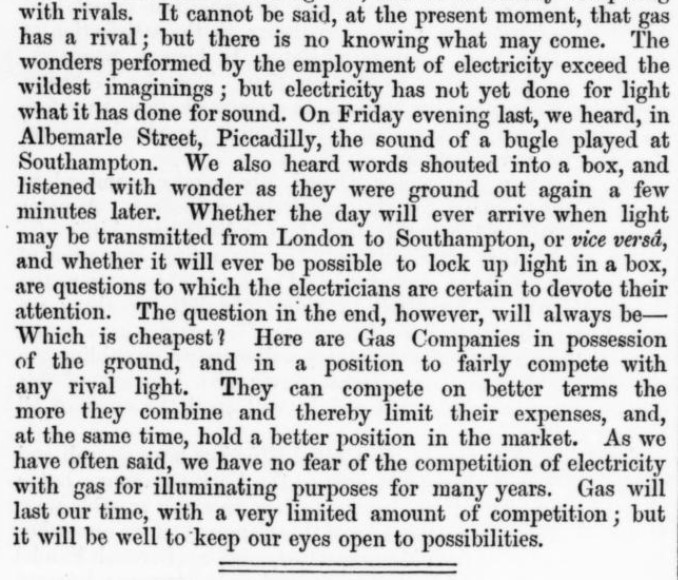
Finally, a paragraph that I found in The Journal of Gas Lighting, Water Supply, & Sanitary Improvement, February 5, 1878: