Carl Mears Paper Confirms Increasing Trend in Atmospheric Water Vapour
Carl Mears, who runs the RSS global satellite temperature dataset, has a new paper out, studying trends is atmospheric water vapour from 1988-2017. The data reveals a significant increasing trend in Total Precipitable Water (ocean only) of 1.49% per decade, which he states is confirmation of the effects of anthropogenic global warming.
Water vapor in the atmosphere is important for studying our changing climate because it is a contributor to the greenhouse effect and the amount of vapor is expected to increase as the planet warms . . . . .
The record clearly shows that the amount of vapor in the atmosphere has been increasing at a rate of about 1.5% per decade over the last 30 years as the planet warms. This is not surprising, since warmer air tends to “hold” more water vapor,but is a nice confirmation of estimates of temperature rise made by other instruments and methods.
1 Introduction
Understanding the long-term changes in water vapor content on a global scale is critical for assessing human induced climate change. Changes in water vapor, which are expected to track increases in global temperature (Trenberth et al., 2005; Wang et al., 2016) lead to a substantial positive feedback mechanism, and well as directly influencing climate parameters that impact human and natural ecosystems, such as rainfall, evaporation and surface humidity. For these reasons, water vapor has been identified as an essential climate variable by the Global Climate Observing System (GCOS)(GCOS-Secretariat, 2015). Over the world’s oceans, satellite borne microwave radiometers have been monitoring the total precipitable water (TPW) since late 1987 (Wentz, 1997).
But is it, I wonder? Here is the image of how that trend looks like when viewed regionally.
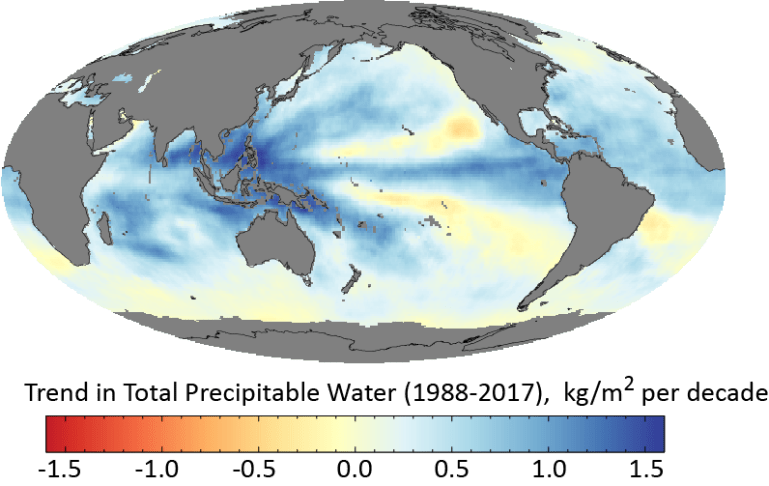
To me, this is uncannily similar to water surface temperature data as measured during a powerful El Nino. I find it very difficult to dissociate the increase in total precipitable water therefore, with the regional increases in Pacific tropical surface water temperatures which are associated with powerful El Ninos. As we have seen, powerful El Ninos have increased considerably in strength and frequency since the beginning of the 1980s, in turn contributing to mass coral bleaching events, which have also been attributed to man-made global warming.
It appears to me that yes, warming is responsible for increasing amounts of water vapour in the atmosphere, but that this warming is intimately associated with the regional ocean surface warming which has manifested as increasingly powerful El Ninos (1982/83, 1997/98, 2015/16 – plus lesser events in between) since the early 1980s. So unless you attribute the occurrence of more frequent and more powerful El Nino events to GHGs, you are left with the conclusion that the increase in precipitable water vapour measured over the last 30 years is largely due to natural causes.

Moving goal posts.
The predicted tropospheric hotspot never showed up, so flailing around for post hoc excuses is all they have.
This paper is asserting that something that varies tremendously, water vapor, is up about 5%. But weather events are not reflecting this, and where is the baseline of historical records? Being “adjusted” like the temperature record….
I seriously doubt if this is anything other than yet another example of climate fanatics toying with the data until they can pretend it shows something scary.
Extra points for skipping over the fact that water vapor is by far the most important ghg.
LikeLiked by 2 people
How does this map look when centered on greenwich meridian? How does the northern atlantic look like?
LikeLike
“Warmer air tends to hold more water vapour” is a poor explanation by Carl Mears, because there would be more water vapour even if the air temperature remained constant. The INPUT of water to the atmosphere by evaporation depends only on the surface temperature of the oceans, so that indeed is the key variable, not the air temperature.
The OUTPUT of water from the atmosphere, by precipitation and condensation, is obviously proportional to the AMOUNT of water in the atmosphere, and the AMOUNT increases in line with the INPUT to the point where OUTPUT = INPUT. The temperature of the air does not come into it at all.
LikeLiked by 2 people
Mears makes the totally unwarranted assumption that the alleged increase in global surface temperature is purely a result of anthropogenic activity, and further claims that there is a direct positive feedback linking small increases in atmospheric water vapour and temperature, also unwarranted.
Added to which, it appears his claims for decadal increase in atmospheric water vapour would contradict the earlier estimates here, especially that in Solomon et al.:
http://www.climate4you.com/GreenhouseGasses.htm
http://onlinelibrary.wiley.com/doi/10.1029/2012GL052094/full
https://www.sciencemag.org/content/327/5970/1219.abstract
So desperately clutching at straws to prop up a failed paradigm, basically.
LikeLiked by 2 people
Hans Erren asks:
How does this map look when centered on greenwich meridian? How does the northern atlantic look like?
The Prime Meridian (and International Dateline) is the outside perimeter of the map. No, it’s not centered on the PM/IDL, but interpreting the data as if it were is not terribly difficult.
You can see the northern Atlantic in the upper right-hand portion of the map as portrayed. A large area of yellow (roughly -0.05 kg/m^2), some neutral bluish-white, with a tiny portion of darker blue (~ +0.8) off the east coast of the Middle Atlantic region of the United States.
Between the Tropics, it’s more concentrated, but that’s to be expected. After all, warmer air holds more water vapor, as the “good” professor notes.
LikeLiked by 1 person
Climanrecon,
“Warmer air tends to hold more water vapour” is a poor explanation by Carl Mears.
Indeed it is. The warmer the air, the greater its capacity to hold water vapour without reaching saturation point. Absolute humidity is a measure of the total mass of water vapour in any given volume of air. Relative humidity is a measure of the ratio of that mass of water vapour to the total mass of wv which that air can contain immediately prior to reaching saturation point. Thus, very warm air can hold huge amounts of water vapour in suspension which is why the tropics are so very uncomfortable – the air is very warm and there is an abundant supply of moisture available.
The supply of moisture, as climanrecon points out, is the critical factor here in determining total precipitable water vapour. Obviously, over the oceans, there is an abundant source of moisture, the availability of which will be determined by the rate of evaporation from the surface, which is dependent upon the surface temperature, the relative humidity of the air just above the surface, and factors such as prevailing winds. The surface temperature of the water is determined during the daytime by the amount of solar insolation received, plus it will depend upon subsurface movements of water and ocean currents which shift stored heat around the system. It’s all very complicated. To merely say that warm air “holds” more water vapour so this is what we should expect from global warming is a gross over-simplification.
LikeLike
What worries me is that there are huge regions of the oceans where the trend is of decreasing amounts of precipitatable water. How does that come about? Are these regions undergoing negative forcing? There is also the fact that over most of the land surface, pan evaporation rates continue to decrease (and natural evaporation rates from water surfaces are probably only 0.75x pan evaporation rates). Are soils becoming more moist or drying out? Presumably also with earth greening, evapotranspiration rates are increasing. Who dares speculate what the overall global change might be?
In geological terms, the Earth is in a wet phase. Aridity, although widespread,m is at low levels and deposition of calcium sulphates, salt, and especially potash salts are at very low levels.
LikeLike
On the map the “trend” is largest over the Phillipines, but how does the complete time series look like. I.e. How much internal variability from el ninos with obvious endpoint selection bias are we seeing in the “trend”? And how does the time series look like between California and Hawaii?
LikeLike
Oops, in a comment above I wrote incorrectly that the rate of water loss from the atmosphere does not depend on air temperature. In fact, the rate of condensation of water vapour increases with air temperature, which puts a further boot into “warmer air can hold more water” as the explanation of the data.
LikeLike
We might expect Evaporo-Transpiration to lower as CO2 rises, at least per kg dry matter produced. Stomata need not open so much to ingest CO2, and that is when water escapes. Usually more than necessary for transpiration water-lift of soil nutrients.
LikeLike
Brett, a recent paper showed evapotranspiration remaining fairly steady over the period 1982-2011, but water use efficiency increasing significantly. But of course this has no bearing on water vapour concentration over the oceans.
https://wattsupwiththat.files.wordpress.com/2017/07/file-20170620-22092-g9flkd_thumb.png?w=758&h=306
LikeLike
Brett, yes indeed, increased water efficiency was a factor I ignored because as you point out it is evaluated per unit of dry matter. And that’s the point, Earth’s greening means the amount of vegetation has increased. Greening is most evident in semiarid and arid climates and here relationships may be counterintuitive. For instance, valleys with trees lose more water than barren valleys.
LikeLike
After considering the papers that counter the conclusion of this paper, perhaps “alleges” is more appropriate than “confirms”?
LikeLiked by 1 person