Canadian Climate Census Communication Car Crash
![]() There’s a new survey on public opinion on climate change in Canada, run by a team of six researchers, see SSRN paper, Montreal website, Yale website. The reporting of the results has been a total cock-up on the communication front.
There’s a new survey on public opinion on climate change in Canada, run by a team of six researchers, see SSRN paper, Montreal website, Yale website. The reporting of the results has been a total cock-up on the communication front.
The results of the telephone poll were first reported as follows:
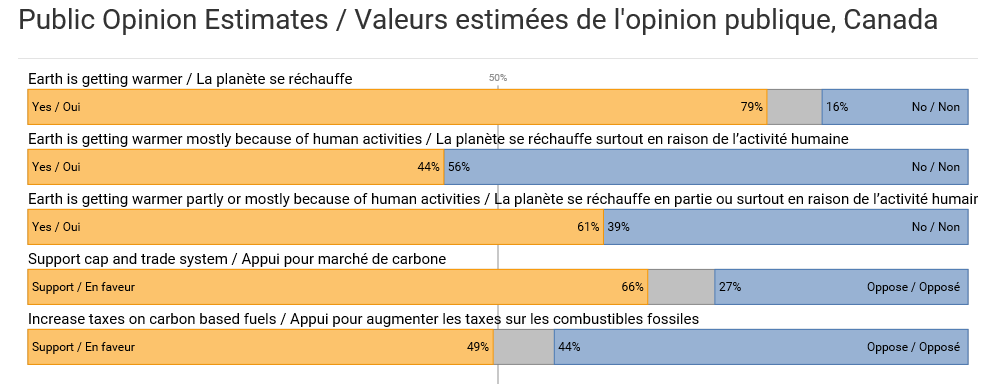
This indicates that only 44% believe that warming is mostly due to human activity, while 56% don’t. This was widely reported at the time, see here and here for example. But then the results of the survey mysteriously changed, and if you look at the websites now, you will see this:
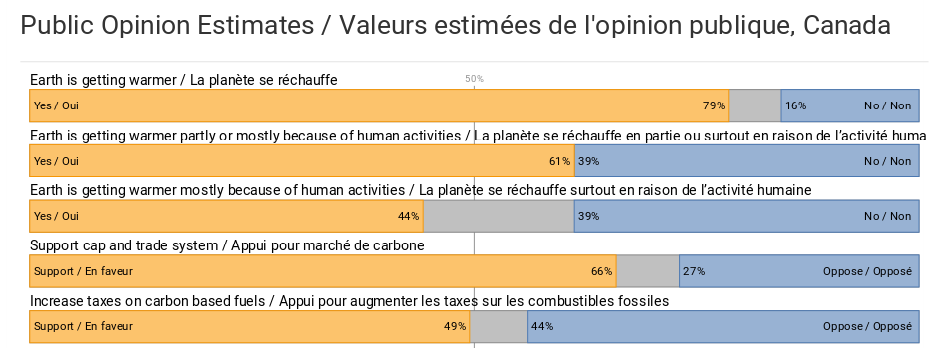
The 56% “No” has suddenly dropped to 39%, and the gap has been filled by the miraculous appearance of a 17% grey area representing the “Don’t know” responses. Curiously however, there seem to have been 0% “Don’t know” responses to the question on “partly or mostly” human activity.
At around this time, the authors of the paper furiously objected to the media coverage reporting what the findings of the study were, leading to a lot of editing of newspaper articles – see Jo Nova’s post on this; also compare the headline with the URL wording in this French-language article.
So which is correct? The 56% “No” or 39% “No”? Fortunately you can apply to get a data file if you agree to certain conditions. I think I am allowed to show this number,
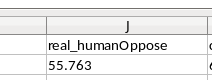
from their data file, as long as I include the text “The CSEE and CCOM project bear no responsibility for the analyses or interpretations of the data presented here.” So it seems very clear, from their own data file, that the original 56% figure opposed to mostly human warming is the correct figure.
Both the Montreal and Yale websites have pages explaining the questions asked and the colour coding, which say that the grey regions are the don’t knows. Amazingly, these two are inconsistent with each other and with the graphical presentation of the results. In the Montreal version, there is only one “Earth getting warmer because of” question, and no responses are shaded blue corresponding to the “No” in the figure, while in the Yale version no responses are in grey, which is inconsistent with the modified graphic.
If you thought it couldn’t get any worse than this, you’d be wrong. Looking at the data presented here in the figures and widely reported in the media, it would be reasonable to assume that people were asked the question “Do you agree that the earth is getting warmer partly or mostly because of human activities”. But if you look again at the questions, this question was not even asked. The relevant question was: “Is the earth getting warmer mostly because of human activity such as burning fossil fuels or mostly because of natural patterns in the earth’s environment?” From the answers to this question, the researchers (I use the term loosely) inferred answers to two different questions. Worse still, in one of those inferred questions there were 17% don’t knows, and in the other there were none!
Just how difficult is it to report accurately the responses to four survey questions?

Question: “Earth is getting warmer because of human activity
[If yes, solid evidence] “Is the earth getting warmer mostly because of human activity such as burning fossil fuels or mostly because of natural patterns in the earth’s environment?”
Mostly human Activity
Mostly natural Patterns
A Combination [volunteered]
Not sure [volunteered]”
What does the word “volunteered” mean here?
LikeLike
Tony, well, yes. That’s another thing they haven’t explained properly. I think, though I’m just guessing, that it means that some people came up with the answer ‘combination’ even though that wasn’t an option explicitly mentioned in the question.
LikeLike
More on this issue at my blog. As a Canadian, I have skin in this game. ( Re “volunteered”: From my experience I am guessing it is a category of response that was not offered by the caller, but was offered by the respondents and was accepted.)
https://rclutz.wordpress.com/2016/02/25/uncensored-canadians-view-global-warming/
LikeLike
Ron, thank you for your perspective as a Canadian. I see you also noticed the changing story and the mismatch between questions asked and results reported. You also note that another question was asked but not reported, which I missed.
I woder if Donna Laframboise might have something to say on this. I can’t see anything on her blog.
LikeLike
From your link at “questions” I went to the Montreal University FAQ page which says:
“The estimates were generated from a statistical model that incorporates actual survey responses from a large dataset of >5,000 individuals that have been collected since 2011.”
It sounds as if they’ve invented some method of estimating answers to questions not asked from the questions that were asked in different surveys, in order to up the sample size and get a measure over time. It’s a terrible thing to do – effectively claiming: “this is what people would have said if we’d asked them this question.”
The link to individual surveys from which the results were compiled goes to the web page of one Erick Lachapelle, and lists no less than 38 of Erick’s papers. Erick, who bears a striking resemblance to John Cook, teaches courses on comparative environmental policy, the politics of climate change, and research methods.
LikeLike
If the sponsors are looking at support for policy, they miss out some questions.
There was no question about belief in whether human-caused warming has been demonstrated to be a major problem. Or whether, Canada, with about 1.6% of global emissions, will make a difference when most of the rest of the world have no plans to cut their emissions. Or about whether climate policy should override other policy priorities.
Yet for climate policy to be beneficial, it needs to overcome a problem. Even if there is a problem, then ineffective and costly solutions will leave people economically worse off, whilst doing little or nothing to alleviate the problem. Also a carbon permit system that is not universal can lead to loss of jobs abroad , whilst a carbon tax is a regressive tax.
Even then, to use opinion polls to justify policy in the absence of robust evidence of policy effectiveness is the the opposite of evidence-based policy making.
LikeLike