A flood of disinformation
Just a quick note from me.
Regular readers will know that I recently scribbled something about that icon of doomsday, Thwaites Glacier. As part of my perambulations around the digital sewer that we call the internet, searching in the sludge for a nugget or two of gold, I came across Justin Rowlatt’s holiday to Thwaites in the southern summer of 2019-20. His breathless report of the visit is here.
Anyway, Rowlatt in discussing the potential for Thwaites to actually bring about the End of Everything featured a map of London showing “areas at risk of flooding” by 2100. It was supplied by an outfit called Climate Central, who seem to specialise in producing terrifying maps of parts of the world underwater.
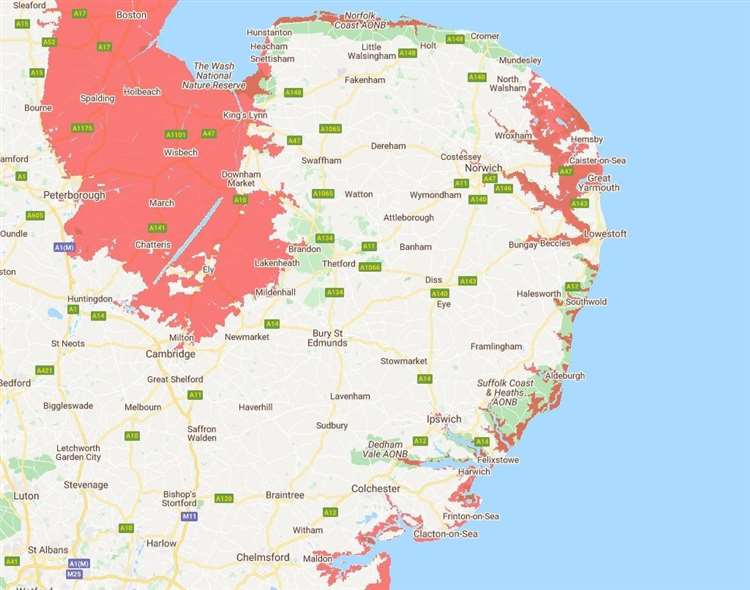
The first one of theirs I saw, way back, was Norfolk:
“Shocking global warming map shows swathes of East Anglia under water by 2050”

Huge swathes of East Anglia will be under water in 30 years unless drastic action is taken to halt global warming, according to a global flood-risk map built by US-based researchers at Climate Central.
Here’s an “East Anglia” version:
“East Anglia could be ravaged by flooding and high sea levels by 2050, according to global map“
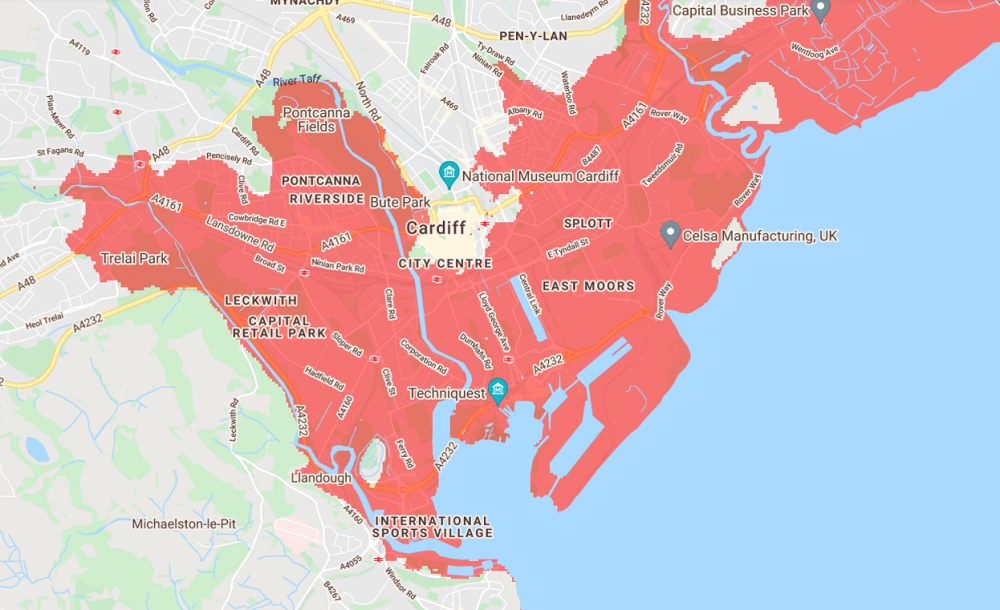
There’s one for Wales…
“Updated climate change sea level risk map shows large parts of Wales flooded by 2050”
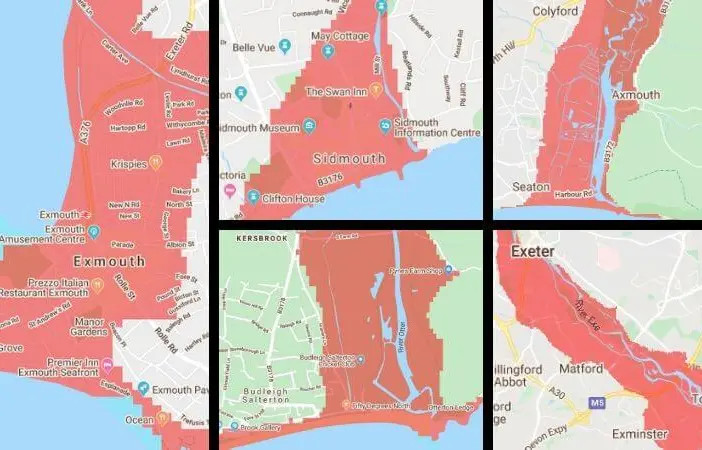
There’s one for Devon… this time with some pushback…
“Study warning swathes of East Devon and Exeter could be under water by 2050 ‘doesn’t realistically predict likelihood of future flooding’”
A study’s stark warning that huge swathes of East Devon and Exeter could be under water by 2050 has been played down by county council chiefs.
I could go on and on, but I won’t. The play seems to be to make maps tailored to local news outlets and fling them about to see what sticks. Many outlets are happy to oblige. A quick cut and paste for a bunch of clicks; in return Climate Central gets its eschatological – or should that be scatological – message out to more punters. (Note: Climate Central might supply a web tool which media outlets can use to produce their own shocking maps. I do not know.)
Emulating the London Map
Here is the terrifying map of London as reproduced by Rowlatt:
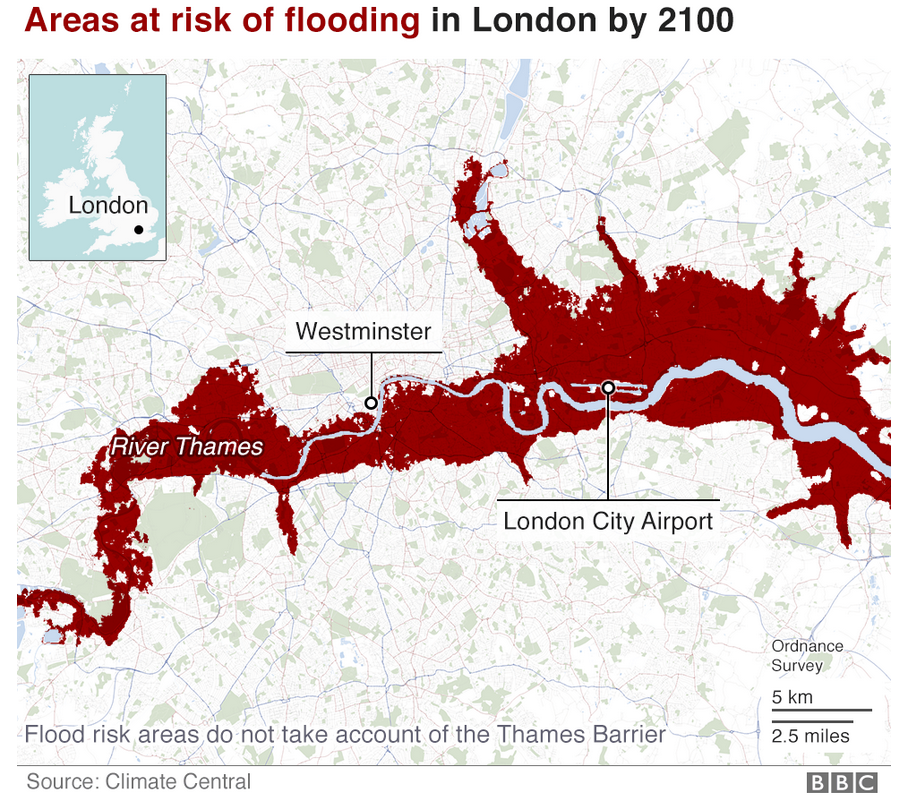
Naturally being a curious sort of chap I wondered how much sea level rise was represented in the map. Luckily there is a freely available digital terrain model of the UK. All you need after that is a GIS program and ten minutes to colour it in. The vertical resolution of the free map is 1 metre, so I was a bit worried that the “by 2100” map would all have happened in the first increment. Surely not. Surely London was not as flat as that.
Well, I added a metre to sea level. Then another. By the time I had reached +10 metres I finally had something that looked a lot like the Climate Central map.

My next thought was, well, if the sea level is rising at 3 mm a year, how long would it take to rise 10 metres? That number in years is 10,000 divided by 3. More or less 3000 years. It’s more but hey. Let’s be generous. So the “map of London in 2100” was actually the map of London in 5000.
But no. Wait! Slow down. Back up. They’re not talking about the incremental creep upwards of general sea level – they’re talking about storms, dude. Big frickin’ storms comin’ in and bashin’ everythin’ about. These things kinda surge.
Yes, but the tops of the surges presumably increment in tandem with the slowly creeping general rise in sea level… so what your map is actually showing is a large blob of London which is already “under threat” of flooding, to which you may have added a further half metre to widen the envelope a bit. Except you didn’t label it that way. The map looks very much as if the Thames itself represents the danger zone in 2020, and the red represents the same in 2100. Disinformation indeed. So I made another version. This map has the last 1 m contour coloured yellow. This region we may describe as “the bits of London under threat of flooding in 2100 that weren’t under threat of flooding in 2020.” The pinkish bits, meanwhile, are “bits of London under threat of flooding in 2020, which will still be under threat of flooding in 2100.”

And that’s with a generous 1 metre of sea level rise.
Are you scared yet? Why not?
Oh, finally, I made my own map of future flooding in Norfolk. As before, I’ve coloured in the 0-10 m contours. It therefore represents, at current rates, 3000 years of sea level rise. Note to the insufficiently alarmed: the blue bits are already at sea level! Yike!


Brilliant! Where’s a BBC climate misinformation correspondent when you need one?
LikeLike
Nothing instils the required level of concern quite like a redrawn coastline. The real story is one of increased levels of risk, but that is a mathematical abstraction that is unlikely to get anyone to glue themselves to the next commuter train.
LikeLike
Also, since when has central Sidmouth qualified as a swathe?
LikeLike
great detective work Jit – wonder if this links in with this post by John – https://cliscep.com/2021/11/11/something-fishy-from-the-bbc/
LikeLike
The climate alarm industry is a joke. The fools running it don’t seem to have realised this yet.
LikeLike
“Here’s an “East Anglia” version”
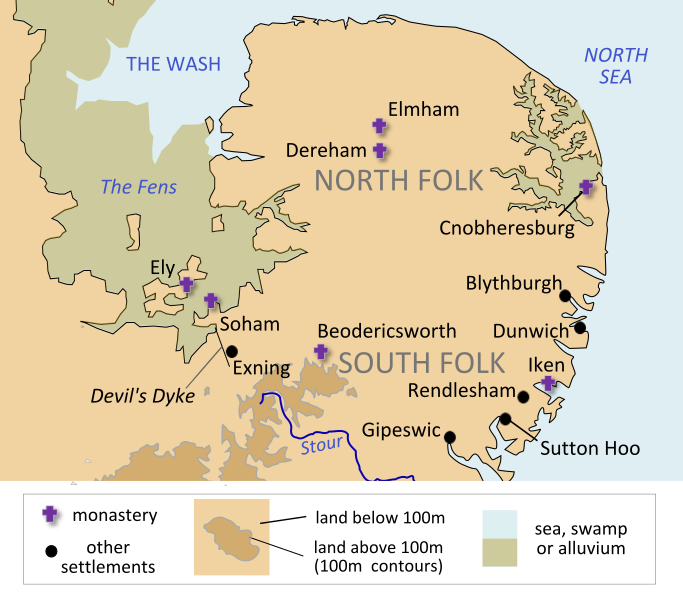
Compare and contrast with this map from WikiP’s “Kingdom of East Anglia” page:
https://en.wikipedia.org/wiki/Kingdom_of_East_Anglia#/media/File:Williamson_p16_3.svg
LikeLiked by 1 person
Jit the drowning of the River Thames Valley parts of London will not be uniform, but episodic. The valley consists of a modern floodplain parts of which occasionally flood today. But there are older river terraces (the Taplow, Boyn Hill and Richmond terraces) lying at higher elevations and underlain by sands and gravels (and sometimes brickearths) each of which is separated from its neighbours or the modern floodplain by steep rises of several metres. The terraces record stages in the down-cutting of the Thames in glacial times due to lowered sea-levels.
I first found out about these features as a consequence of the enlightened teaching of the man that taught me geography. After taking my O-levels there were still several weeks before schools broke up for the summer break and we had nothing to do. Our geography teacher told us about river terraces and sent us out on our bikes with road maps of our local east London area with instructions to map the occurrence of abrupt changes of level – features we knew well and used to gain speed for our bikes wizzing down those slopes. After a day’s mapping we returned to the school where our teacher drew out the local Geological Survey map and compared it with our map. We found that we had demarcated the different river terraces by our mapping of these abrupt slopes. With a single stroke that teacher had changed the way I saw my local area, convinced me that I should do A-level Geology and ultimately read Geology at University, and much later visit some of the gravel quarries set within the river terraces, there to find bones of bygone animals and human hand axes, three of the latter decorate my bedroom furniture to this day.
So these terrace boundaries will halt the continued rise of seawater.
LikeLiked by 1 person
Of course terrace boundaries won’t halt the continued rise of sea water (nothing can withstand the power of CO2). Terrace boundaries will, however, for a time anyway, halt the increase in areas subject to potential flooding. But who knows what Londoners will do several thousand years hence?
LikeLike
Dougie,
Strictly speaking, JIT’s article does not link in with mine because I concentrated upon claims for an increase in water temperature within the Thames tidal reaches rather than sea level rises. However, there is a link to the BBC article and ZSL report that my article had covered. The findings of the ZSL report were as follows:
“The results show that sea levels have been increasing on average since monitoring began in 1911 at all gauging sites in the Tidal Thames (Figure 4.5). Comparing linear trends over the full monitoring period (1911 to 2018) with linear trends in recent years (1990 to 2018), every gauging site showed there has been an increase in the average rate of mean sea level rise per year since monitoring began. While Tilbury had the highest average rate of increase from 1911 to 2018 at 2.68 mm/year (+/-0.09), Silvertown surpassed this from 1990 to 2018 with an average rate of change of 4.26 mm/year (+/-0.62).”
What this means for flood risk is a matter for further mathematical modelling but, as dfhunter pointed out at the time, the link is not straightforward and requires more than just modelling. Also, the geological history is important. As Alan has pointed out, current levels of flood risk in Greater London have more to do with a glaciological legacy than global warming. The same must be said for the erosion of the UK’s eastern coastline.
Finally, looking at the Rowlatt map of London’s 2100 flood risk areas, you will note the caption ‘Flood risk areas do not take account of the Thames Barrier’. Mmm.
LikeLike
John, thanks for stressing that last point. It alone makes Rowlatt’s scaremongering unjustified. “This is what could – in an unlikely scenario – happen to London if we hadn’t taken mitigation measures, except that we have.” Where is the BBC’s climate misinformation team when you need it?
LikeLiked by 1 person
Joe, when I first saw the Norfolk map my first thought was of a map of Roman times that I had seen (which I crudely reproduced in Denierland. The map at your link is better:
LikeLike
Alan, thanks for the geological perspective. It’s interesting on the maps that the sinuous Thames loops from side to side within the floodplain, as we might expect. Of course once a settlement occurs, the natural cycle of erosion and deposition is curtailed. I wonder how long the terraces would persist in the normal run of things – until the next Ice Age?
LikeLike
John/Mark, all the worst-case scenarios of sea level rise rely on the victims doing nothing to help themselves. This is beyond stupid. You can assure someone crossing the road that they are going to get run over, but they might look at you quizzically and say, “Only if I stand still for long enough.”
By the way John, Dougie = dfhunter.
LikeLike
“Of course once a settlement occurs, the natural cycle of erosion and deposition is curtailed.”
Not any more! The environment agency has for decades resisted dredging and managing river banks properly and removing dead trees, because it wants everything to go back to nature. Hence, much more (avoidable) flooding, collapsing banks (park footpath near me fell into the river recently), and so on.
LikeLiked by 1 person
Climate Central* has updated its mapping tools since Rowlatt published that London map. One of the changes is that CC now uses better elevation data.
A ‘legacy’ DTM is still offered at the website and if you use that along with the scariest projection options that are currently offered (SLR plus ‘moderate flood’, ‘unchecked pollution’ [sic], ‘bad’ luck and the second IPCC 2021 option), you get a very close – identical, I reckon – match to Rowlatt’s map, but only if you generate a map for 2150, not 2100.
https://coastal.climatecentral.org/map/11/-0.1655/51.4599/?theme=sea_level_rise&map_type=coastal_dem_comparison&basemap=roadmap&contiguous=true&elevation_model=srtm_contig&forecast_year=2150&pathway=ssp5rcp85&percentile=p95&refresh=true&return_level=return_level_10&rl_model=gtsr&slr_model=ipcc_2021_low
That Rowlatt said his map was for 2100 needn’t indicate incompetence or dishonesty. It’s possible that back then Climate Central was using much scarier sea level-rise projections. (I think AR6 was scarier about sea level-rise than AR5, but CC might have been using non-IPCC projections. It did when it started.)
Whichever the year, what was the ‘water level’ (SLR plus storm surges) that Rowlatt thought his map showed? 10m as Jit suggests? Plausible. Using the current DTM at the CC website, the closest I can get to Rowlatt’s map is 6.0m, but that’s flooding a different terrain, innit. Rowlatt’s ‘legacy’ terrain might have been flooded to 6m or 10 or 3.
To know for sure, you’d have to find a pirate copy of the ‘legacy’ DTM (CoastalDEM 1.1) and stick it in QGIS or whatever.
*
Climate Central also likes to scare its world with mockups of what SLR will do to famous buildings. Its Buck House pix…
https://picturing.climatecentral.org/location/51.500733,-0.142602
…are based on the unfathomable projections of CoastalDEM 1.1. You can tell they haven’t been updated to the only slightly less unfathomable CoastalDEM 2.2 by clicking on ‘View on Map’, where you’ll see flood levels that are nothing like those shown in the pix.
Why is nobody celebrating such good news?
Only two years ago, Climate Central reckoned that the whole of Buck House would be flooded. Now it envisages a few puddles near the Victoria Memorial. Hurrah!
===
*Whose funders include Leonardo DiCaprio.
**Orphaned footnote: Newspapers have repeatedly made alarmist interpretations of Climate Central’s already somewhat alarmist output. Here, for example, is The Independent:
https://www.independent.co.uk/climate-change/news/london-flood-map-risk-b1917001.html
‘These are the areas of London that face alarmingly frequent flooding by 2030.’
Apparently, Climate Central is a ‘new NASA tool’.
Tools do seem to be involved. Also dimwits.
LikeLike
JiT,
>”By the way John, Dougie = dfhunter.”
Come to mention it, I did know that once — in my pre-senile days. Thanks for the correction, and apologies to Dougie, dfhunter and all other pseudonyms.
LikeLike
The water benchmark at stable geolical site, Isle of the Dead, Tasmania, struck by Antarctic explorer Sir James Clark Ross and amateur scientist Thomas Lempriere in July,1841 shows little sea rise, despite CRU claims to the contrary.
http://www.john-daly.com/ges/appendix.htm
LikeLike
One of the more amusing features of climate bed-wetters is their inability to recognise that some things are worth quite a lot of money. Economics never enters their arguments.
Hence most of the coastal major cities of the world continue to grow in size, as land that is hugely valuable is reclaimed. London has steadily worked its way towards the Thames, not away from it. I predict, quite strongly, that Manhattan will increase in size over the next 100 years. The value of the land gained will more than pay for the cost.
An exception is Venice, because they have decided to freeze themselves in time. 16th Century Venetians would have simply raised the land level. We don’t need to follow their example.
LikeLiked by 1 person
no apologies needed John – when I comment it used to auto fill in my name as dfhunter, but now I have to input my name for some reason (so now i’m Dougie – AKA dfhunter
LikeLiked by 1 person
So Dougie is an accidental Orwell. The other type of pseudonymous actor that has sometimes been used destructively I called the Bourbaki (on Bishop Hill in October 2012). And while I was pining from Covid for ten days from 3rd January I read The Nine – about a band of heroic French Resistance women who escaped a death march from a concentration camp in Germany and reached the Americans at Colditz. When they got back to Paris which resistance hero had organised the massive logistics for General de Gaulle at a luxury hotel to welcome them back, with thousands of others, and process them (including weeding out traitors)? Mathematician André Weil, brother of Simone and founder member of Bourbaki in 1934. Well, I thought it was interesting 😉
[Sorry, the first link was wrong – now corrected — rd]
LikeLiked by 1 person
Dougie,
The embarrassing thing is that I was aware of the pseudonym but, in what can only be described as a senior moment, I lost the plot.
LikeLike
Richard,
An anecdote regarding the Bourbachique Mathématique? How could that not be interesting?
In a similar vein, I am indebted to John D. Barrow, in his book Pi in the Sky, for introducing me to the following quote by Goethe:
“Mathematicians are a species of Frenchmen: if you say something to them they translate it into their own language and presto! it is something entirely different.”
LikeLiked by 1 person
John, the thing that always struck me about Bourbaki is the self-denial, especially from André Weil, who was brilliant enough to make a great name for himself, if he so chose. He was always close to his sister Simone, though she died tragically young, and she also was ‘extreme’ on self-denial, from an explicit, though unconventional, Christian point of view. (I like that combination but that’s just me!) Reading The Nine brought back these thoughts and the glaring contrast with the self-indulgence of most climate thinkers, including Christian Aid and evangelical preacher Kathy Hayhoe. That may need thinking about. But self-indulgence is all over this movement, in a way that’s the polar opposite of heroes like Weil and The Nine, led by the great Hélène Podliasky.
One of the reviewers of the book on Amazon wrote this:
General de Gaulle, despite his inspired choice of Weil to head up the processing centre at the Lutetia Hotel, helped the women survivors of the Resistance – better at not bragging in the pub about their work and better at not betraying their comrades under torture – in their self-denial by asking them to give way to the men, as he honoured the male of the species almost exclusively after the War. Yet these women needed to talk about their experiences. And now, very late, they’ve been given a voice.
Lindzen’s comments about this generation looking for a purpose that compares with those on offer then is very pertinent I feel. But our search is so often highly self-indulgent. (An empirical finding, not a religious one.)
LikeLike
Richard,
I am aware that the Bourbaki group operated under a shared alias, but I’m not sure that I have ever read why. It’s not as though they were a team of assembled avengers, always available whenever a mathematical theorem needed rescuing from an evil non-generality. Or were they?
LikeLiked by 1 person
Ha. I’m not sure we know all the reasons why but I buy the idea that the name was chosen in honour of Charles Bourbaki and this striking incident:
“All for one and one for all” being a related angle. André Weil being a genuine hero in the fight against the Nazis sits well with all this. But far be it from me to suggest on Cliscep that scientists and even mathematicians can ever have base motives that need challenging by novel, self-denying methods of organisation.
LikeLiked by 1 person
Richard,
I certainly go along with the idea that the army officer was the inspiration behind the alias. This is what John D. Barrow says on the matter:
“No one seems to know why the group of French mathematicians who began the project named themselves after a non-existent Frenchman. It seems they may have been inspired by an army officer, General Charles Denis Sauter Bourbaki, who was prominent in the Franco-Prussian war and apparently declined an offer of the throne of Greece in 1862. A decade later his fortunes had reversed and we find him and his soldiers interned in Switzerland where he attempted to shoot himself – but missed. There is a statue of him in the town of Nancy, and many of the Bourbaki collaborators have been connected with the University of Nancy during their earlier careers. There are many other peculiar stories about the real Mr Bourbaki, most of them created by the Bourbaki group to keep the legend suitably embellished.”
None of the above, however, answers my basic question: Why operate under a collective alias? If it was just a stunt to help distinguish the group from other schools of mathematical philosophy, then it has worked exceedingly well.
LikeLiked by 1 person
Hmm, tricky. But my next non-answer will have to be this evening. I liked the Goethe by the way. It sounds a fun book.
LikeLike
They’re still at it, by the way:
https://www.chroniclelive.co.uk/news/north-east-news/shocking-maps-show-north-east-26751113.amp
The comments are more sensible than the article. Which shows something.
LikeLike
I know that area well. It’s appalling alarmist nonsense, IMO.
LikeLike