Mark has written about the latest EDGAR release here. As last year, I also wanted to show some figures illustrating the global picture in 2024 and the changes since 2023.
Global Emissions of CO2
Why CO2, and not GHG (including CH4, etc)? Well, CO2 comes from burning fossil fuels, and the others come from a variety of processes. I think CO2, as the main greenhouse gas, is the one to focus on. I doubt this analysis changes fundamentally if we replace CO2 with total GHG.
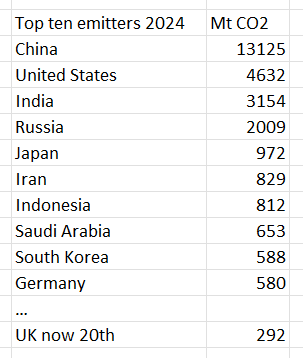
The world’s total emissions went up from 39.1 Gt CO2 in 2023 to 39.6 Gt CO2 in 2024. The net rise was about 520 Mt CO2 year-on-year, a quantity somewhere between Brazil and Canada’s annual total last year.

The top ten emitters are tabulated below:
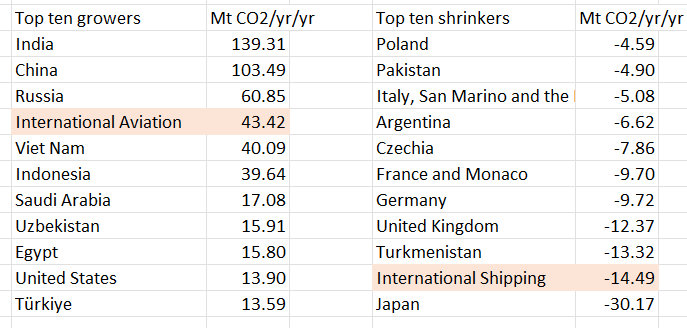
And here are the top ten growers and shrinkers, with “Internation Aviation” and “International Shipping” included:
Per-Capita emissions
The highest per-capita emissions come from Palau, at 63.7 t CO2/person/yr, and the lowest from the Faroes, at 42 kg CO2/person/yr. Warm jumpers? These figures compare to the global average of 4.888 t CO2/person/yr, and the UK’s of 4.254 t CO2/person/yr.
ASTERISK: averages conceal a lot of detail. The median value is a lot lower than the average, thanks to the relatively few individuals with large carbon dioxide emissions to their name. This applies globally and within each country; the distributions are heavily right-skewed. Humans on the planet in the most frequent emission bin are personally responsible for 2-3 t CO2 per year – that is a SWAG, because the data does not allow the number to be computed.
Interestingly, the per-capita emissions of the average world human has not changed much over the years – see the grey line in the figure below. Some countries have grown their per-capita emissions, and others have reduced theirs. I know you can think of examples: I show a tale of two such countries below.
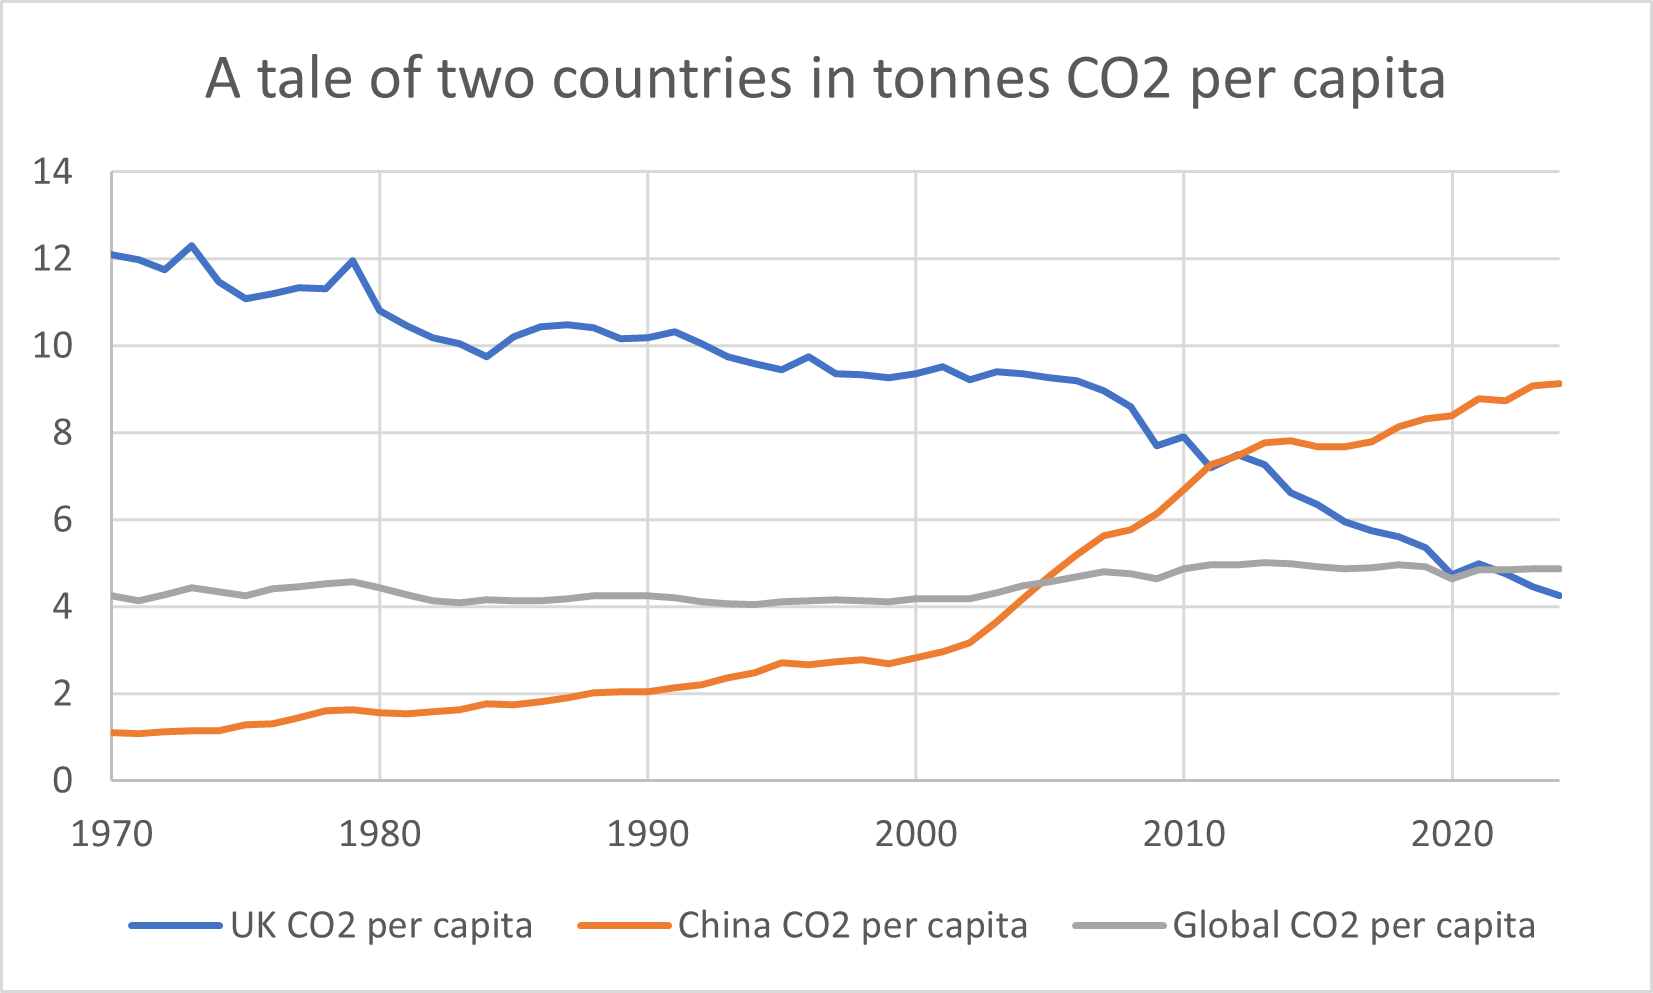
There are various ways of determining when the UK peaked as a country. They generally, to my mind, point in the same general temporal vicinity:
Maximum energy use: 2000
Last year with a budget surplus: 2001
Last year as a net exporter of energy: 2003
Peak productivity of employment in energy: 2005
See here for more on the energy part of these.
Meanwhile, the other featured country joined the WTO in 2001 and has not looked back. Rather spookily, China’s rise is almost a mirror of the UK’s decline.
GDP vs CO2 emissions
At first they said we could cut our emissions and still have more. Then they said we had to stop growing altogether, or shrink. The people saying this are among those who have so far been largely unaffected by the UK’s, and the West’s, attack of climate angst and piety.
The next figure shows just how decoupled wealth was from carbon dioxide emissions in 2024. A few countries are labelled. [Note the log-log scale.]
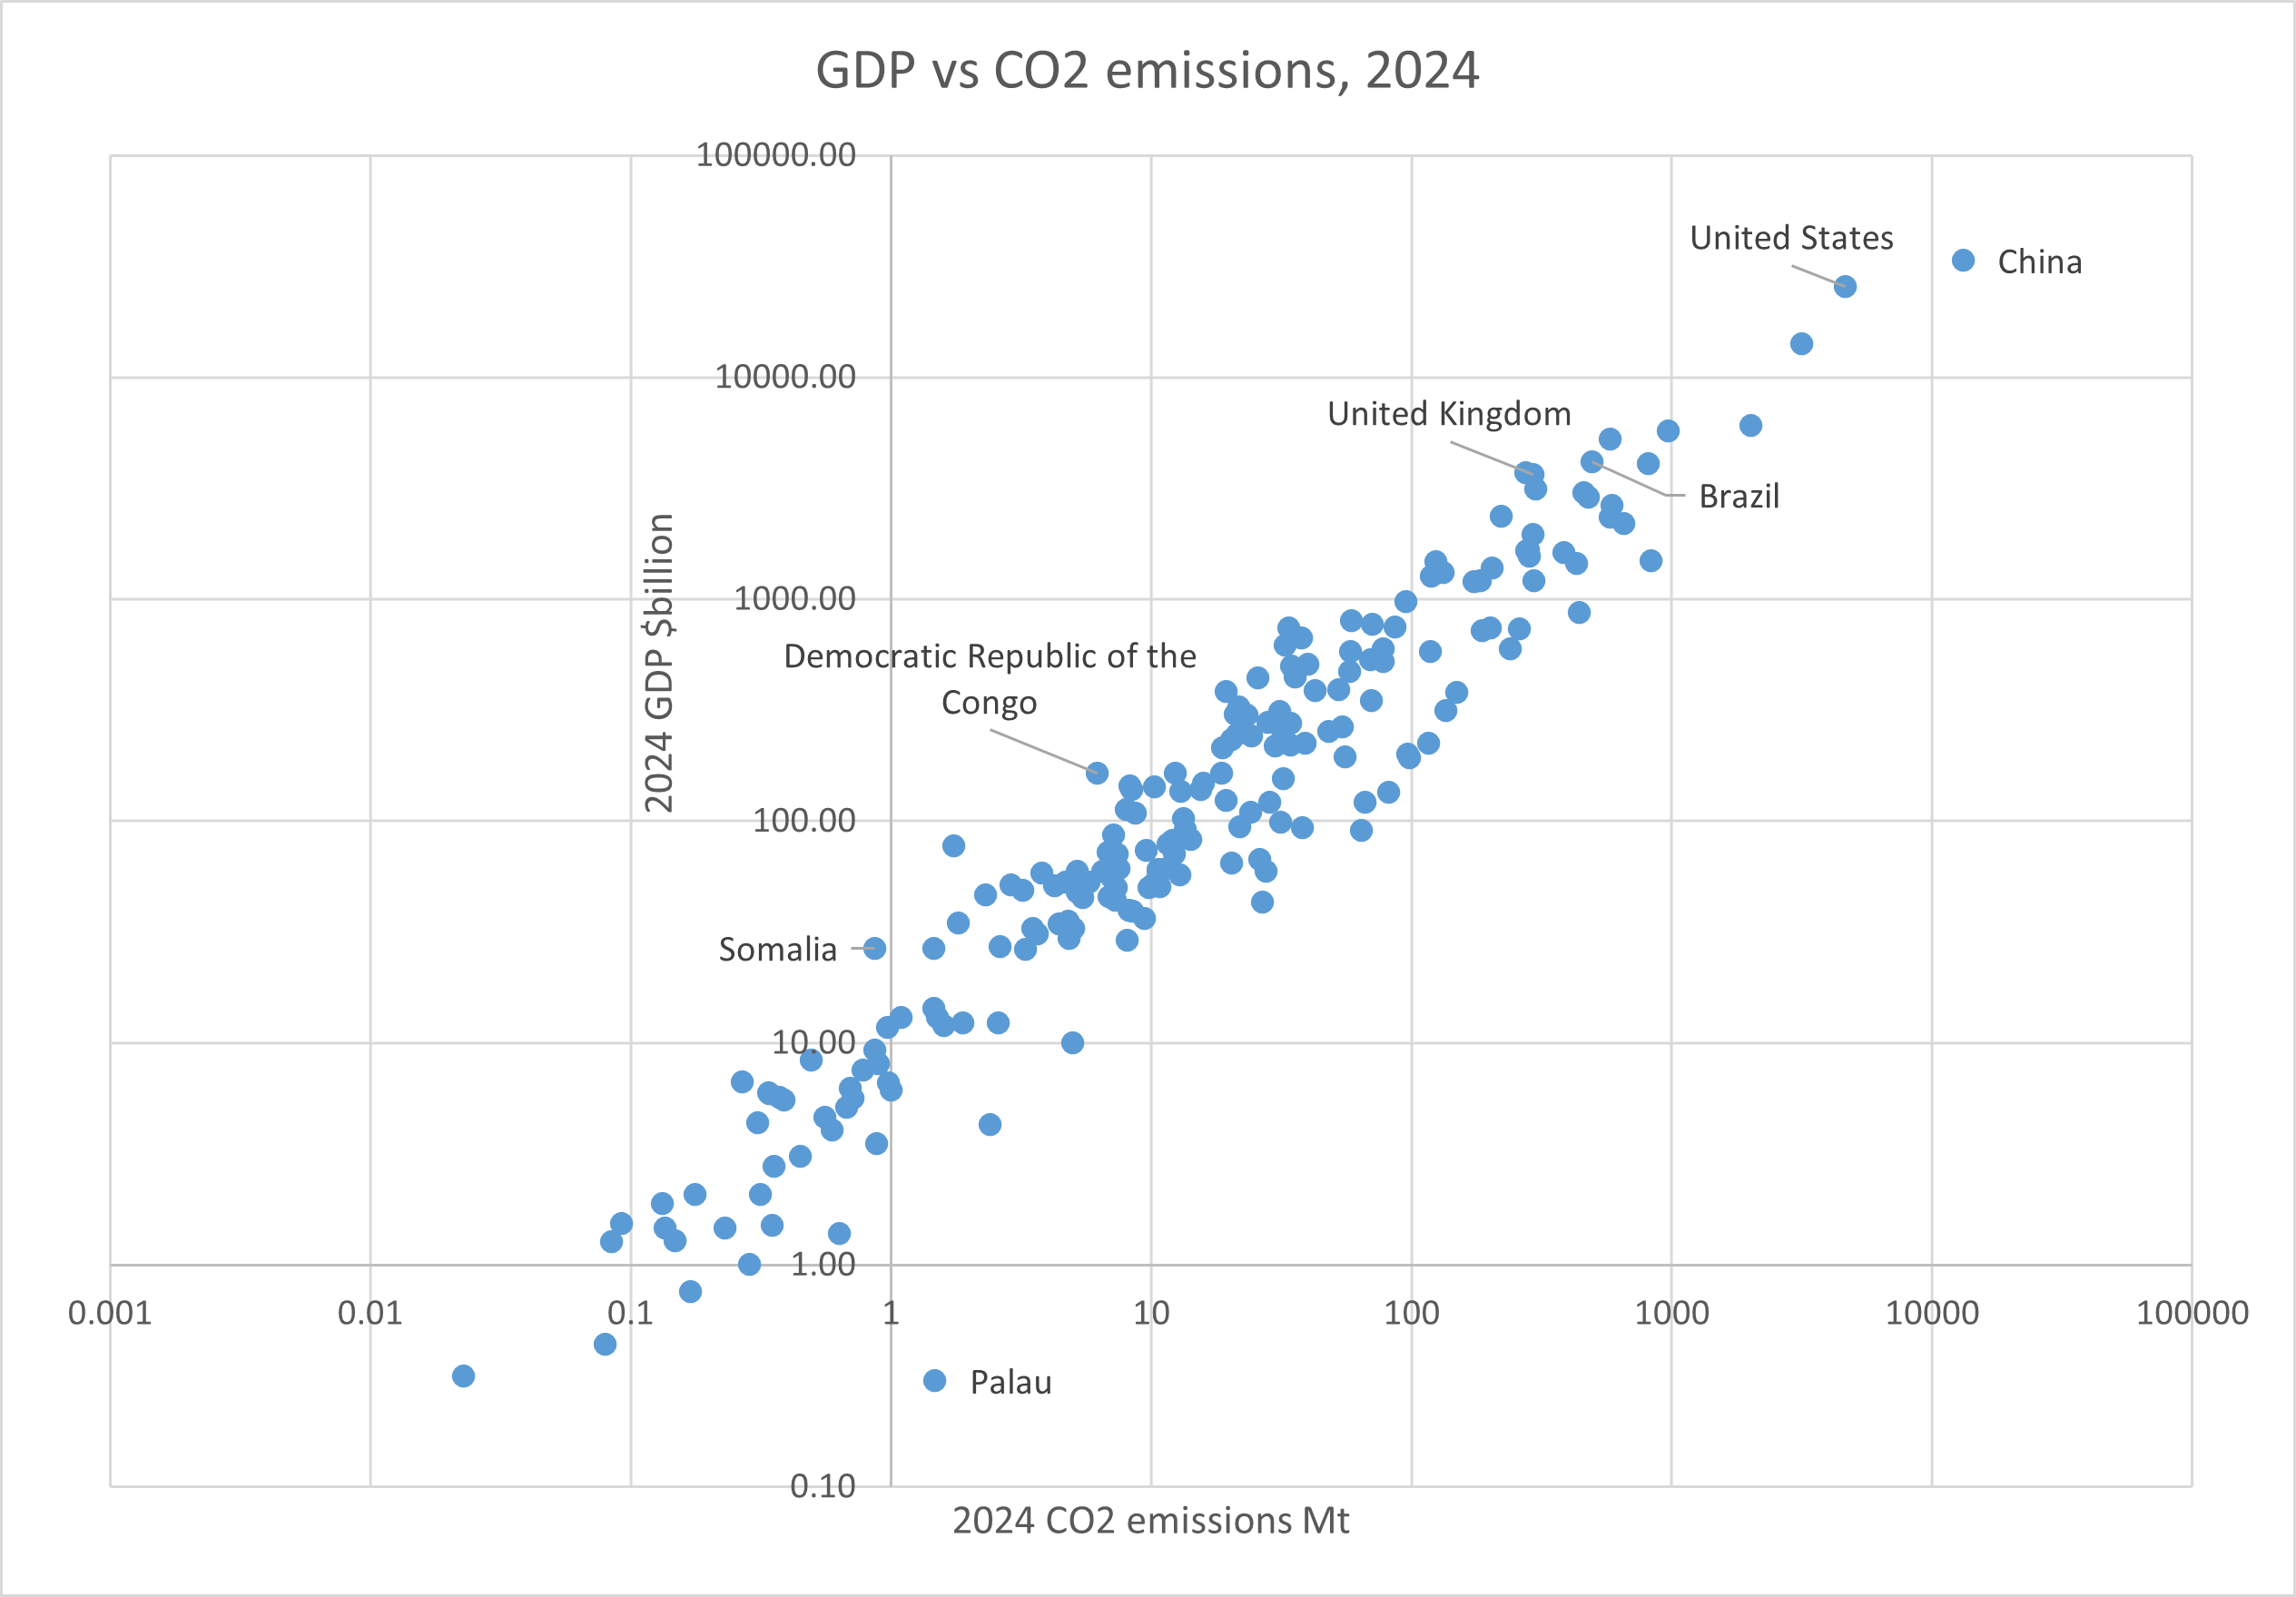
ASTERISK: the GDP data is back-calculated from within the EDGAR spreadsheet. Ultimately, it seems to come from the World Bank (PPP). It is at least plausible that both GDP and CO2 are estimates with common supporting variables – that the relationship is so clear because of this connection.
When it comes to your country’s GDP, there are two ways to grow it on this figure. One is to increase your energy use, and your fossil fuel energy use. [Moving right and up in the cloud.] The other is to allow technology to enable a more efficient use of energy. [Moving vertically in the cloud.] The plan of reducing emissions and growing GDP is not one that looks viable on the evidence of this figure.
It has been done, as the final figure shows. Here, 2001 and 2024 numbers are plotted on the same axes. Several countries are labelled. All the labelled countries have grown. Some have grown while increasing their emissions – others while decreasing them. The distributions have shifted up and right.

ASTERISK: Developing countries naturally grow both emissions and GDP as they industrialise. But it is worth noting that the emission cuts made by for example the UK in this period were some of the easier to do: swapping coal for gas as electricity generators for example.
Editorial
Cutting CO2 – we all love it, like paying taxes or obeying rules. We just like it when some other mug is doing it. Even criminals prefer to operate in places where everyone else is doing what they are supposed to.
Of the 208 countries in the EDGAR database, 47 made emissions cuts last year. On the other hand, 161 countries increased their emissions.
The majority of countries just do not care about CO2 emissions. They will enjoy watching the countries of the decadent West cutting theirs.
Data
EDGAR here. The good folk at EDGAR tend to revise previous years’ data, so do not carve the presented numbers into an Edstone. [2023 numbers have changed this year, for instance.]
Bonus video
In case we’re all feeling very depressed about all this, let’s semi-ironically cheer ourselves up with four minutes of Randy Newman.
/message ends

Since the largest use of hydrocarbons fuels is in transportation, the country comparison metric should be CO2 emissions per M sq km.
OOPS, that puts UK right up there with South Korea, Japan and Germany.
Anyway, Dr. Happer hits the nail on the head:
LikeLiked by 1 person
Interesting Ron. But I suggest you update it to 2024, using the EDGAR data to which Jit refers.
LikeLike
I don’t think it makes sense to compare countries that way. Giant countries with what we might dysphemistically call wastelands where no-one goes will score well in such a list. But the fossil fuel use of their cities and people may well not differ at all from a small densely-packed country’s. It does not measure the effect of a country’s people on global CO2 concentrations; square metres do not emit carbon dioxide [well they do, but you know what I mean], people do.
You might as well rank countries by GDP per square metre, or the size of their army per square metre. And that’s before you get into the weeds of the aspect ratio of a country, and that some countries are adjacent to other countries, etc.
LikeLike
Ron’s comment is interesting, since it raises again the spectre of their being numerous ways to analyse statistics. There is something there for everyone.
I think the key data are confirmed in the charts, which undermine the narrative that the UK can “decarbonise” while growing the economy. It is indeed true, as net zero activists insist, that the UK’s GDP has grown at the same time as (territorial) emissions have fallen. However, it is abundantly clear that major economies with higher emissions and greater energy use are doing better than major economies with lower emissions and energy use. So while it’s true that emissions reductions don’t necessarily equate to no growth, they very probably do equate to much lower growth than might otherwise be achieved. In other words, for all the talk of net zero being a great economic opportunity, the reality is that it is economically (and environmentally, never forget) damaging.
LikeLike
“Global use of coal hit record high in 2024
Bleak report finds greenhouse gas emissions are still rising despite ‘exponential’ growth of renewables”
https://www.theguardian.com/environment/2025/oct/22/global-use-of-coal-hit-record-high-in-2024
Coal use hit a record high around the world last year despite efforts to switch to clean energy, imperilling the world’s attempts to rein in global heating.
The share of coal in electricity generation dropped as renewable energy surged ahead. But the general increase in power demand meant that more coal was used overall, according to the annual State of Climate Action report, published on Wednesday.
The report painted a grim picture of the world’s chances of avoiding increasingly severe impacts from the climate crisis. Countries are falling behind the targets they have set for reducing greenhouse gas emissions, which have continued to rise, albeit at a lower rate than before....
If I can find the time and the energy, I may have more to say about this before the end of the week.
LikeLiked by 2 people