The best kind of predictions of climate doom sit in a sweet spot, happening soon enough to stimulate fear but not soon enough to be quickly shown to be yet another crock of ****.
The median time horizon for predictions of an ice-free Arctic is 16 years. This seems to be about right. Who remembers stuff that someone bleated about in 2006? [Well, “Arctic Death Spiral Update” does, but that’s not the point. Nobody important is going around jabbing their finger at these disappointed Nostradamuses and telling them, “Sling yer hook! You’re fired!” Hell, even making up data or faking “smoking gun” memorandums doesn’t get you put on the naughty step for twelve minutes these days.]
The median time between prediction and “apocalypse” was said to be 20 years by Rode and Fischbeck [See here for Tony’s appraisal of same; my lengthy comment is close to the bottom].
However, I digress, because this particular presentiment of doom had a time window, not of 16 or 20 years, but 4 days. Prof Sir Admiral King, once the government’s Chief Scientist and now the commander of a flotilla of plastic battleships that he sends on daring missions up and down his bathtub, made a bold prediction about the number of deaths that would be caused by the then-imminent heatwave. It was on the 16th of July, the Saturday, when he told LBC that “up to” 10,000 deaths were to be anticipated on the following Monday and the Tuesday [inclusive? Unclear]:
Sir David continued: “You mention figures of thousands of deaths. I’m afraid the excess deaths on Monday and Tuesday have got to be anticipated at least in that sort of range… a few thousand up to 10,000.”
LBC
Well, it was a bold prediction indeed to make on the 16th that thousands would die on the 18th -19th, but Prof Sir Admiral King knew what he was talking about. He was proven right, and the ONS duly reported that 8,700 excess deaths occurred on both the two very hot days.
What’s that? They didn’t report a large excess of deaths? I think you’ll find you’re barking up the wrong tree, Mr. Denier. I have the data right here somewhere, and if you simply casually glance at the weekly mortality figures for the year 2022, the heatwave week sticks out like the Matterhorn.
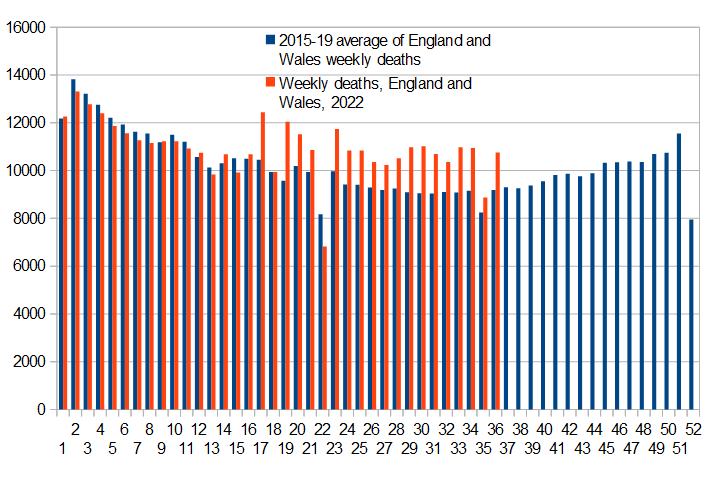
Whaddaya mean, which week was it? Oh. Hang on a mo, let me just work it out. Yeh. It was the week ending 22nd July, so it was week number 29.
[Multiple caveats: the large majority of deaths are registered within a week of occurring, and almost all (barring those requiring inquests) within two weeks. Some weeks are lower than the seasonal trend: these may relate to bank holiday weeks where not as much gets done as normal. The drop in the average death rate at Chrimbo is not a miracle: deaths then are pushed forwards, particularly into week 53 [not shown here]. I did not use the 5-year average including 2020 or 2021 for obvious reasons, and the population will have grown in the interim.]
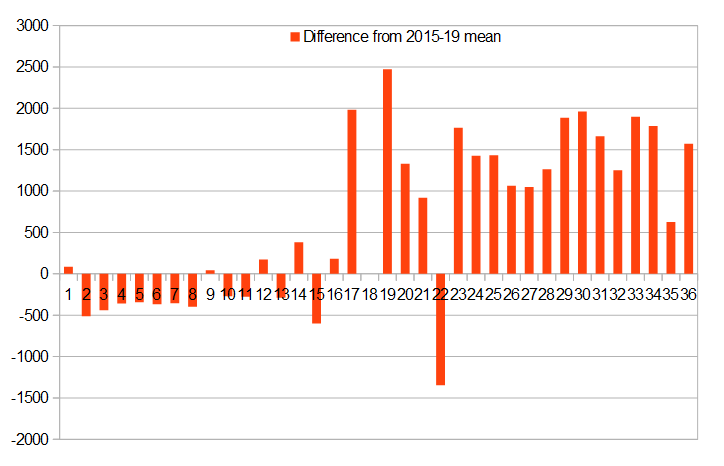
In fact, there has been an excess of deaths every week since the beginning of May, with the exception of week 22, which included an extra bank holiday and an extended weekend. And while there is potentially a further elevation in death rates in weeks 29-30, representing heat wave casualties, they certainly don’t number close to 10,000. The highest excess is week 19, where almost 2500 excess deaths were recorded. That was more than the same week in the (2nd) pandemic year of 2021 and only about 600 less than the (1st) pandemic year of 2020.
The question remains: what is causing the excess deaths in England and Wales this year? There is a suggestion that the responsibility lies with lockdown, and the prolonged suspension of NHS services. I don’t know. Perhaps Prof Sir Admiral King has the answer.
Note
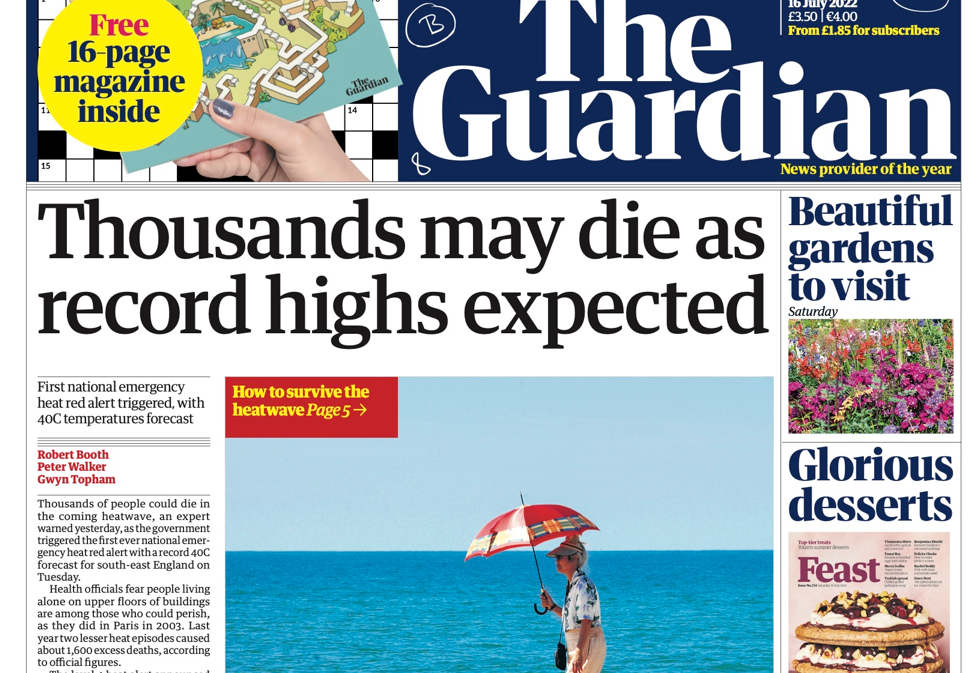
Paul Homewood also covered Prof Sir Admiral King’s true prediction. King was about the doomiest about the heatwave that I could find. Most media were cagey in putting actual numbers on things. The Guardian said “Thousands may die,” but it didn’t say how many thousands.
See here for some more of Prof Sir Admiral King’s balderdash as transcribed by me at the time.
Featured image
A shack near Frinton-on-Sea. [Actually a hide, but it had been vandalised.]

Jit,
Going from the ONS data, it would seem that excess deaths during the July heatwave periods amounted to 1,344 for England and Wales combined. By excess, I mean in excess of the rest of July. This figure is derived from the following statement:
“…Average daily death occurrences during these dates (1,224 deaths for England and 83 deaths for Wales) were higher than the rest of July (1,149 deaths for England and 74 deaths for Wales; a 6.5% and 12.3% excess, respectively).”
But let us not be too harsh on Prof Sir Admiral King. He did say “up to” 10,000 deaths and, since 1,344 is definitely less than 10,000, then in a very important respect he got it right 🙂
LikeLiked by 1 person
John, now I’m confused. My spreadsheet has 10,978 registered deaths for week 29 (England and Wales). That’s an average of 1568 per day. 90 of those were in Wales.
Using the weekly data I’ve got, the difference in deaths between the first two weeks of July and the 3rd-4th weeks is about 1600 in total. Some part of that could be ascribed to heatwave deaths, but there are similar excesses in other weeks since May, so it’s not obvious.🐱💻
LikeLiked by 1 person
Perhaps the discrepancy is a reporting delay thing. If not, then I can’t explain it, but at least our figures are closer to each other than they are to 10,000.
As far as attributing deaths to climate change is concerned, that is virtually impossible to do reliably. Causation questions like this always require answers to counterfactuals, i.e. what the death rate would have looked like without AGW. The best one could do is to predict how much of the excess heat was due to AGW (using the old climate model re-run trick), subtract that from the achieved temperatures and then look up how many excess deaths are historically associated with such a discrepancy in temperature (hoping that all other causations remain equal). Thus calculated, the actual number of deaths that would have not happened if it were not for AGW will be substantially less than the excess recorded during the heatwave.
LikeLiked by 1 person
At the risk of going O/T for a blog called Climate Scepticism, there are questions that need answers regarding the excess deaths this summer, not just in the UK, but over much of the world. It does seem odd, given the excess deaths over the last two years from covid (which might lead us to expect lower non-covid deaths this summer), and I don’t believe that they’re down to climate change. If they were, I think the usual suspects would be shouting it from the rooftops by now.
LikeLiked by 2 people
To avoid accusations of this blog being mis-labelled, perhaps consideration should be given to it being rebranded as the more-accurate ‘Climate and Weather Scepticism’?
LikeLike
John, on causation, if memory serves Captain Stott of the Met said that without climate change the 40 degree heatwave would have been a 1 in 1000 year event. With climate change, it was of course more likely, and by 2050 it will be every other Tuesday or sommat. But 1 in 1000 chances do happen; the nature of probability is that unlikely things happen all the time. [A nasty trick is to ask someone how likely it is that two people share a birthday.] I do not want to know how the sausage is made, but I am quite sure I would be horrified to discover how these probabilities were calculated. And was Stott referring to the temperature with UHI, or without it?
Mark, not off topic at all. I hoped someone might enlighten me as to what is going on, or proffer a hypothesis. A friend tells me that “people are dying of everything.”
Joe, I am a sceptic about apocalypses generally. So far I’m on a long winning streak. One day I may be wrong. That is the weakness of proof by induction. See my comment on Tony’s piece.
LikeLiked by 1 person
“I am a sceptic about apocalypses generally. So far I’m on a long winning streak.”
We all are! 😉
LikeLike
Jo P., Is anyone sceptical about the weather?
In this kingdom, most people discuss it incessantly and it is commonly the first item of conversation. Most people have opinions about predictions of it, from what will happen over the next few minutes, to the rubbish of BBC predictions or guesses as to whether the big game will be ruined by rain.
LikeLiked by 2 people
So far this discussion seems unscientific to me
If we are counting the impact of heatwaves we need to calculate the number of QALYs Life Year Lost
The “show me the bodies rule applies”
So first I need to see how many dead heatwave bodies we have
ie on the death certificate
However no one is tweeting such a tally
Nor is there any obvious story in the media.
So I conclude there weren’t many heatwave dead bodies.
Furthermore if you find me 100 95 year olds with that on the D Cert I am not particularly bothered
cos it’s not going to tally up to many QALYs
LikeLiked by 1 person
While living in Andalusia about 20 miles inland from the coast, the usual practice to announce the death of a villager was to ring the church bell. During the very hot summer’s in the 90’s the bell rang quite regularly ! The thing is, the bell rang quite regularly during the winter every year.
LikeLiked by 1 person
I used to live in Calahonda, inland is probably more sane
I remember hitching inland and walking in places like El Camino Del Rey before most people ever heard of it.
LikeLike
Jit; “Mark, not off topic at all. I hoped someone might enlighten me as to what is going on, or proffer a hypothesis.”
The Daily Sceptic has carried a series of articles about the continuing tally of excess deaths. For example:
https://dailysceptic.org/2022/09/21/wave-of-mainly-heart-deaths-tops-17800-but-government-still-wont-release-data-by-vaccination-status/
They have made the point a few times that, as well as being unexplained, the numbers are counter-intuitive since, following the ravages of covid, the tally should be lower than normal.
LikeLiked by 1 person
today anyone over 83 was born before the war
anyone under 77 was born after the war
3 groups before/during/after
There might be different lifespan resilience between the groups
ie the after cohort has many weaker people ?
LikeLike
The BBC has returned to the subject:
“Record excess deaths in UK’s heatwave summer”
“As the UK endured record high temperatures of 40C this summer, there were around 3,000 more deaths than usual in England and Wales – the highest figure since 2004.”
https://www.bbc.co.uk/news/health-63171417
Of interest here is that the figure of 3,000 refers to what they are calling ‘heat periods’, which are defined as periods of 20c or above, average, i.e. a period of summer days. The figure is therefore relating to the excess deaths due to normal summer weather as well as anything that was unusually hot. However, the headline is written to give the impression that 3,000 is the number of excess deaths due to climate change (since we all know that heatwaves are 100% the result of climate change).
Actually, the figure is 6% above the ‘five year average’ – presumably meaning it is 6% above the five year average for excess deaths. Therefore, 6% of 3,000 would be nearer the mark. Furthermore, as Stewart has already pointed out, the real mortal impact has to be measured in terms of quality years lost. The really important statement is buried deep within the article:
>Sarah Caul, head of mortality analysis at the ONS, said: ‘During the UK summer of record-breaking temperatures, there was an increase in deaths. However, these spikes around the hottest days were followed by periods of below average mortality. This is likely to be a result of short-term mortality displacement, especially among older age groups, where people died a few days or weeks earlier than expected’.
So the real headline should have been:
“Record levels of short-term mortality displacement in UK’s heatwave summer”
LikeLike
On second thoughts, they probably just mean that 3,000 represents a 6% excess. If so, how this excess compares to previous excesses is unclear to me. Even so, it is that difference that matters and not the headline 3000.
LikeLike
Okay, I’m having a senior moment here. If every excess is with regard to averages for the previous corresponding months, then the headline figure does matter. I have been thinking in terms of a summer excess over an annual average. Someone help me out. I sense early onset senility.
LikeLike
We’re going for a walk later. (Call the nurse.)
LikeLiked by 1 person
Looks like the 3,271 deaths represent 6.2% more than the summed daily deaths for the equivalent selected days during an average summer, which added up to 53,032. The total over the periods of the heatwaves was 56,303.
Therefore the overall excess over the entire summer would be lower than 3,271 owing to decreased deaths in the intervals between the heatwaves?
I’m not really sure, nor how this squares with the data that seem to show an excess every week, with more of an excess perhaps on the very hot weeks. Is this owing to an increasingly ageing population? Perhaps I should email ONS to ask them to explain it to me in words of one syllable.
LikeLike
Jit,
I’m glad it’s not just me who is struggling to decipher the ONS statement. I think the two main things to take away are that the deaths represent short term mortality displacement, and that even an average summer will result in deaths that exceed the annual average. However, given the heatwaves, this year will have seen an excessive excess. I’m just not sure how to quantify this given what the ONS has said about mortality displacement.
LikeLike
I still can’t get this right. Cold related deaths outnumber the heat related ones, so the annual average (i.e., the mean) was never going to be the correct comparison. ‘Excess’ only makes sense when the comparison is between a given time of year and the average for that time of year. In the meantime, the number goes up and down during the year, but at no time does that represent an excess in itself.
I’m going for that walk that Vinny recommended. If I have any time after that, I might read this:
“Impact of hot temperatures on death in London: a time series approach”
“Much work in the field has been based on isolated episodes (“heatwaves”); however, such studies are criticised on the grounds of an uncertain baseline and on the overestimates that can be produced from short-term mortality displacement.”
https://jech.bmj.com/content/56/5/367
LikeLike
had a read from your 2002 link paper – from the “DISCUSSION” section –
“This is predicted to result in an increase in hot summers like that experienced in 1995 from once every 75 years based on the temperature distribution for 1961–1990 to about every three years on average.20 There have been suggestions that Weather Watch warning systems, which alert vulnerable populations to impending “heatwaves”, may prevent deaths in urban centres which, because of the heat island effect, are particularly likely to experience the adverse effects of heat.21 Our results suggest that the trigger for activating such a system in London should be a predicted temperature of 21.5°C, or possibly even earlier at 19°C when some heat effect was observed. Whether or not such systems are cost effective requires evaluation. Our results also suggest that the timing of hot periods in any year may be an important consideration. In addition, analysis of separate heatwave periods suggest that episodes of long duration and of highest temperature have the largest health effect.”
I notice they also say “The excess of deaths during the 1976 heatwave was estimated to be almost twice as high as at any other identified period”
ok, that was 46yrs ago & the paper was from 2002, but they may have inspired “Weather Watch warning systems, which alert vulnerable populations to impending “heatwaves”.
LikeLike
Dfhunter,
Yes, it is an old paper but interesting nevertheless. I was particularly intrigued by their finding that a hot June can kill more than a hot July or August, even when it hasn’t been as hot. This suggests that acclimatisation is an issue. The relatively modest temperature at which the problem kicks in was also quite a surprise. Other findings were less surprising, such as that the duration of heat raises the death rate disproportionately (which is one reason why the Summer of 1976 was so lethal). Also, did my eyes deceive me or was there a graph in there (figure 2) that emphasised that the heat related death problem in winter is still far greater than it is for summer — at least back in 2002? It is also interesting to note (as you have) that the idea of a Weather Watch warning system goes back a long way.
Anyway, I suppose the most significant aspect of the study is that it demonstrated that a time series approach to the analysis is the only one that makes much sense.
LikeLike
UnHerd’s Freddy Sayers interviewed an actuary about the excess deaths. The interviewee thinks the excess deaths (mostly from heart conditions) are to do with covid hangovers and rejects any notion that they might be due to spike protein shenanigans. Unfortunately he begins poorly by not pointing out that the deficit of deaths in the beginning of the year is an illusion owing to the pandemic boosting the 5-year average (as factored out in my figure in the opening post.) Worth a watch/listen.
LikeLike
I see the BBC Data Journalism Team, with info from the Met Office, give all the records broken –
https://www.bbc.co.uk/news/science-environment-63244353
“Climate change: Summer 2022 smashed dozens of UK records”
a couple of quotes from the post (which has a nice pic to emphasise how hot UK was) –
“One west Yorkshire village broke its previous record by a whopping 6.3C”
“Scientists at the Met Office who carried out the analysis described this summer’s extreme temperatures as a “real indication of how our climate is changing””
“Temperatures passed 40C (104F) for the first time, something “virtually impossible” without human-induced climate change, according to the Met Office.”
“”The first recording of over of 40C in the UK was a landmark moment and a real indication of how our climate is changing,” Dr McCarthy told the BBC.
“The impacts of this kind of heat became evident in parts of the UK with transport disruption, wildfires and health implications affecting the population,” he added.”
“On average, the summer was 0.4C warmer than the previous record, only set last year.”
LikeLike
Does one become cynical of everything the BBC reports even to the point of interrogating every scene in the latest Somalia drought report ? We were shown a map with the various famine areas but nothing in the neighbouring countries ? The panorama views of the countryside had a green tinge in the background suggesting foliage ? Most of the people and children looked in reasonably good shape compared to the scenes from the Bob Geldof children in need days , or am I being very cynical ? Anyway , the reporter did say Somalia was susceptible to drought and had an ongoing rebellion which would not help , but climate change was the main culprit. Africa can be a fabulous continent , it can also be the most terrible of places. I grew up in Nigeria and witnessed some terrible human suffering typical of Africa, the Biafran war , famine north of Kano with the nomadic Tuaregs taking the brunt of it. The local population shrugged their shoulders and said ” that’s their problem we are fighting a war”. The war was nearly 1000 miles away in the rainy season !
LikeLike
ps – tried to find where the info & location for “One west Yorkshire village broke its previous record by a whopping 6.3C” came from, with no luck.
but the Met Office (old news) “A milestone in UK climate history” – https://www.metoffice.gov.uk/about-us/press-office/news/weather-and-climate/2022/july-heat-review
snippet –
““It’s notable that of the 30 hottest days by UK area averages, 14 of these have occurred this century. While five dates in the list are from the infamous summer of 1976, it should be noted that the heat seen then was much less intense than that of 2022, although much more prolonged.”
not in Scotland or Isle of Man mate.
“Met Office Chief Scientist Professor Stephen Belcher said: “In a climate unaffected by human influence, climate modelling shows that it is virtually impossible for temperatures in the UK to reach 40°C.
“Under a very high emissions scenario we could see temperatures exceeding 40 degrees as frequently as every three years by the end of the century in the UK. Reducing carbon emissions will help to reduce the frequency, but we will still continue to see some occurrences of temperatures exceeding 40°C and the UK will need to adapt to these extreme events.”
Blackpool, here I come for my Hot Summer Hols & save the CO2 on flights.
LikeLike