“Analysis: UK emissions fall 3.6% in 2024 as coal use drops to lowest since 1666” Carbon Briefs said a couple of weeks ago, while tooting their kazoos. The records were tumbling. Not only was coal use the lowest since 1666, but also, the UK emitted less CO2 than any year since 1872.
That the last coal-fired power station had closed was trumpeted, or kazoo’d, and excuses were made for the closure of the Port Talbot blast furnace:
“…it is not at all clear that the UK steel sector would have fared differently – or that the Port Talbot blast furnaces would have remained open – in the absence of climate policy.”
Sure. That’s why Tata commissioned a new blast furnace at Kalinganagar, bringing the site’s capacity up to 8 million tonnes per year. It’s going to be India’s largest, and “a key enabler of socio-economic development in the region.” Meanwhile, all we are is ashes.
But I didn’t come here to talk about that. Rather, I wanted to make a note about Net Zero, and how it is the wrong benchmark if we are supposed to be measuring the UK’s contribution to global CO2 emissions. [Parameters are Capitalised below.]
How so? Well, the target of Net Zero is for Net Zero Territorial Emissions. This number consists of emissions that we produce, in manufacturing, heating and transport etc in the UK, and includes exports. Thus:
Territorial Emissions = emissions created & consumed here + emissions created here & exported
The parameter missing, when it comes to measuring the UK’s total contribution to CO2 emissions, is:
Emissions created elsewhere and consumed here
This lacuna gives rise to many ways to move emissions off-book. Mr. Drax emits over 10 million tonnes of CO2 per year, as reported here. But those emissions count against the countries that cut down their forests to feed him, not against us. So, if we want to save another 10 million tonnes of emissions… all we need to do is open another wood-pellet burning monster, call her Mrs. Drax, and hopefully find unscrupulous countries willing to destroy their forests in order to massage our Net Zero spreadsheet.
All those Chinese EVs that are floating across to us? The emissions associated with them counts against China’s ledger. The solar panels? Ditto. We can get a lot closer to Net Zero if we just stop making cars altogether, and stop making solar panels…
…what’s that? We don’t make solar panels?
I wonder why.
OK, so what should we be measuring? Not Territorial Emissions, but Consumption Emissions.
Consumption Emissions = emissions created & consumed here + emissions created elsewhere and imported here
Note that this number is net of any emissions that we export. Thus, if we build a Transit Van…
We don’t build Transits any more. They moved production to Turkey ten years ago.
… OK, but pretend that we did, and then exported the van to, say, Turkey – the associated emissions would not count on our books.
Our Consumption Emissions would equal our Territorial Emissions if exports and imports of emissions were exactly in balance. But we know, without even looking at the numbers, that we import more emissions than we export, right? In other words, while Carbon Briefs can kazoo about how our emissions are the lowest since 1872, they are glossing over the obvious point that we import far more than we did back then; other people make our stuff now. In fact, it’s fair to say that we were net exporters of emissions in 1872, just as we are net importers of emissions now. Those exported emissions would not have been on the Victorians’ books, even if they had bothered to compile carbon dioxide accounts.
Just how different are the two measures, when it comes to the UK?
I was getting to that. The ONS produces statistics that include Consumption Emissions. But as the accounting for the embodied emissions in far-flung places is Quite Hard, the stats come with a three-year lag. That means the most recent stats I can find for this date to 2021.
In 2021, our Territorial Emissions were 421 Mt CO2e. That’s the number against which Net Zero is to be judged; it has to reach Zero by 2050.
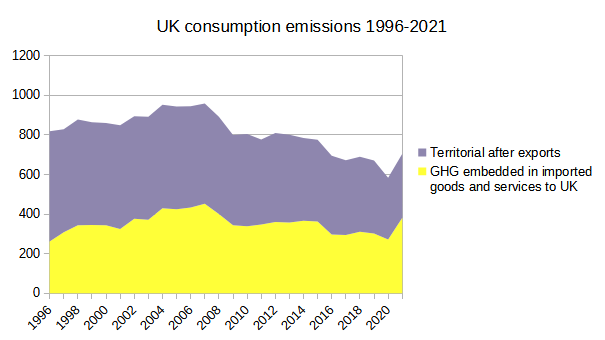
In 2021, our Consumption Emissions were 705 Mt CO2e. That’s the number that measures our actual impact on global CO2 emissions. This number does not have to reach anything by 2050; it can stay at 705 Mt, if we like.

The yellow area shows Imported Emissions. The other three strips DO NOT add up to Territorial Emissions. That’s because Territorial Emissions includes our Exported Emissions, which are not shown here.
The difference between Consumption Emissions and Territorial Emissions is 284 Mt CO2e, and it is worth remembering that 284 Mt is the net of Imported – Exported Emissions. In other words, we Imported 284 Mt CO2e more than we Exported in 2021.
Luckily, because the ONS figures include the emissions embedded in Imports, we can also calculate how much we exported.
In 2021, Imported Emissions (yellow stripe in the figure above) were 381 Mt CO2e, and as the net was 284, we can calculate that our Exported Emissions were (381 – 284) = 97 Mt CO2e. Quite a trade imbalance, I’m sure you’ll agree.
If you glance sideways at two numbers: Consumption Emissions of 721 Mt CO2e and Imported Emissions of 381 Mt CO2e, you will notice that the Imported Emissions are now more than half of our Consumption Emissions. This proportion will inexorably rise; by 2050, if we hit Net Zero then, ALL of our emissions will be imported.
The next figure shows the UK’s Consumption Emissions as before. As before, it shows the amount attributable to imports. The remainder is relabelled as Territorial Emissions after exports. I think this shows more clearly that Imported Emissions have not really changed at all, while emissions produced and consumed here have gone down markedly.
The final figure shows how Territorial Emissions are going down much faster than Consumption Emissions. On the trajectories shown, the UK will hit Net Zero in 2050 all right, as far as Territorial Emissions is concerned. But we will still be importing c. 400 Mt CO2e, which will be on the books of other countries. That’s more than the UK’s 2024 Territorial Emissions that Carbon Briefs are kazooing about (371 Mt).

CONCLUSION
In 2021, and for the first time, Imported Emissions (381 Mt) accounted for more than half of the UK’s Consumption Emissions (705 Mt). The UK’s Territorial Emissions (421 Mt in 2021) have dropped substantially, and it is these against which Net Zero must be judged. But Territorial Emissions do not truly represent the UK’s impact on the atmosphere; Consumption Emissions do.
Using Territorial Emissions as the stat of choice enables net importers, like the UK, to gloss over what is really going on, by hiding their carbon footprints off book. People of the UK will still be responsible for lots of emissions long after we reach the hallowed Net Zero, if we ever do.
CAVEAT
Should our trading partners reduce their carbon intensity, then a smaller amount of CO2 will be imported. Similarly, the UK can reduce its exports of CO2 in two ways: one, by exporting less; two, by reducing the carbon intensity of production.

Beautifully put Jit – thank you.
LikeLiked by 1 person
Jit, I have not done the sum but each one of us sinful humans (while we are alive) emits more CO2 than we inhale – life is like that. I wonder if this is significant in the Net Zero calculation? Is so, what are we to do about it? There seem to be three options:-
LikeLiked by 1 person
A very useful analysis, to which I would add three points.
First, how can Carbon Brief keep a straight face when reporting on the reduction of coal use in the UK in the context of steel production, while reporting this?
This was largely due to lower steel production, which fell from 5.6Mt in 2023 to 4.0Mt in 2024, a reduction of 29%. This 1.6Mt drop in production was mostly offset by a 1.3Mt increase in imports. [My emphasis].
Second, these problems are, of course, what the Climate and Nature Bill sought to address, even if it was a deeply flawed draft piece of legislation. Third, I can’t help plugging one of my own early contributions to Cliscep, in the context of trying to work out who is emitting what and how it should be calculated/counted:
https://cliscep.com/2021/03/28/how-do-you-measure-hot-air/
LikeLiked by 1 person
lowest coal use since 1666?
I wasn’t aware we kept a ‘log’ of use back then or 1872 for that matter.
LikeLike
lordelate – “The UK used just 2.1Mt of coal in 2024. This is the lowest amount since 1666, when the UK’s capital city was engulfed in the Great Fire of London.”
IIRC – the navy & domestic use cut down nearly all the trees in southern England. At the same time coal mining in the north was just getting started & replaced wood as heating/power.
But agree, not sure about the 1666 claim.
LikeLike
move this if needed – Heavy snow leads to collapse of 26 buildings in New York county
LikeLike
It’s all smoke and mirrors…….
LikeLike
“Thousands of jobs at risk as British Steel threatens closure”
https://www.bbc.co.uk/news/articles/cjryeqrnldvo
and
“UK carbon emissions fell by 4% in 2024, official figures show
Less use of gas and coal in electricity supply and industry sectors drove reduction, Department for Energy Security and Net Zero says”
https://www.theguardian.com/environment/2025/mar/27/uk-carbon-emissions-fell-by-4-in-2024-official-figures-show
Is anyone, at the BBC, the Guardian or the DESNZ joining the dots?
Interestingly, the Guardian piece makes no distinction between the UK’s territorial emissions and its consumption emissions. It’s great news, apparently, that 4% drop in emissions, despite the export of jobs and emissions to China and elsewhere. Toot those kazoos!
LikeLiked by 3 people
“How countries cheat their net zero carbon targets – video”
https://www.theguardian.com/environment/video/2025/mar/27/how-countries-their-net-zero-carbon-targets-video
Net zero is a target that countries should be striving for to stop the climate crisis. But beyond the buzzword, it is a complex scientific concept – and if we get it wrong, the planet will keep heating.
Biodiversity and environment reporter Patrick Greenfield explains how a loophole in the 2015 Paris climate agreement allows countries to cheat their net zero targets through creative accounting, and how scientists want us to fix it.
A loophole? It’s got more holes in it than emmentaler cheese!
LikeLiked by 2 people