Regular readers will know that I am obsessed by the way the UK government uses the wrong number to measure its “success” in “tackling” the “climate crisis.”
They love to claim that we are charging towards Net Zero: but Net Zero only counts greenhouse gas emissions produced and consumed within this country. It does not take into account the world making our plastic tat for us. In fact, we could in theory reach the hallowed land of Net Zero, and have reduced our impact on the Earth’s atmosphere not one iota, if the numbers just so fell that way, if we weren’t overrun by rats the size of cats before then.
I was prompted by David Turver’s recent piece on this topic to revisit the ONS page for the UK’s greenhouse gas emissions. Now, I broached this topic in March last year, “Hello, is that Net Zero? Sorry, wrong number,” and I hope showed beyond any doubt that the way we measure our emissions is a joke, an accounting trick that makes the pain look as if it was all worthwhile when it was in fact pure self harm. In July I updated the figures to 2022, which is still the most recent available data at the ONS.
Well, looking at that ONS page again a few days ago, I was struck by how similar the UK’s consumption footprint looked in 2022, to the way it did in 1996. I was surprised I had not pointed this out in my July note – but just how different were the two numbers? Here is the ONS chart showing the UK’s consumption emissions over the 26 years of data:
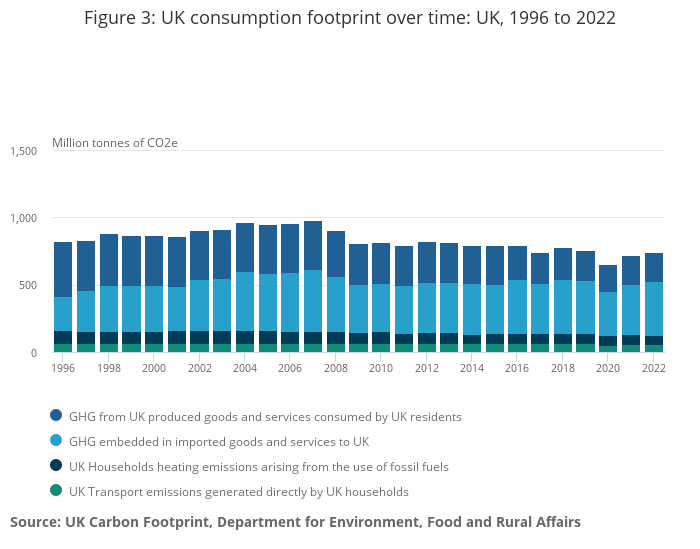
…and here are the numbers for 1996 and 2022. There are four buckets. Emissions produced and consumed here; imports; heating; and transport.
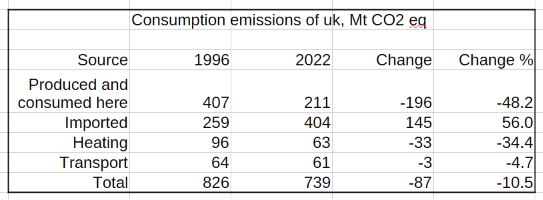
The consumption emissions of the UK went down
10.5%
…between 1996 and 2022.
All that pain. All the threats, the cajoling, the subsidies, the insulation schemes, the bans, the mandates, the marches, the blocked traffic, the smears, the hypocrisy, the hyperbole, the misery, the skyrocketing power bills, the birds swatted out of the air, the shuttered factories, the Low Emission Zones, the lost jobs, the scrappage schemes, the grandstanding, the COPs, the CCC, the madness of Drax, the exploded power stations, the recycling schemes and fuel duties and the punishing taxes…
…all for a lousy 10.5% reduction in our greenhouse gas emissions?
The data can be sliced in various different ways, and some of them seem to show we are winning painlessly, while others show we are losing painfully. There are, in fact, so many ways of presenting the UK’s GHG emissions [or CO2 alone, if preferred] that things can quickly become bewildering. My little spreadsheet here (you can get your own version from the ONS page linked above) shows a range of measures of emission levels: territorial, residence, consumption, emissions produced and consumed in the UK, imports, exports, and net exports.
[Territorial (the Net Zero relevant metric) is not the same as “emissions produced and consumed here.” It’s the latter, plus our Exports, which count against the exporting country for accounting purposes.]
The success story, the one that certain people like to toot their kazoos about, is the Net Zero-relevant Territorial Emissions:
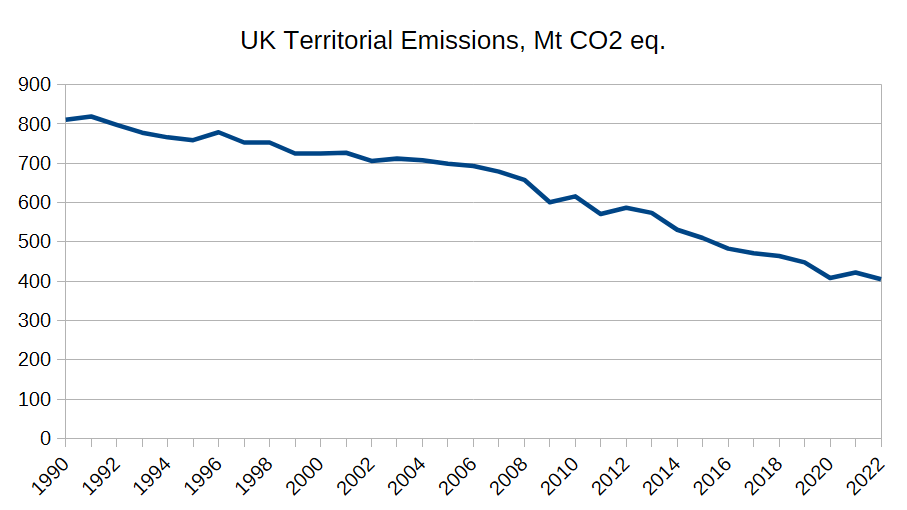
(I’m only showing data up to 2022 here, for that is the latest date we have for the other metrics.)
Looking at this, you can see our descent into hell is well in hand, or as some might say, we are on target to meet our legally-binding blah blah blah.
(The phrase “descent into hell” reminds me of this from John Masefield:
…reaches behind him to the poetry shelf…
He knew that they were after him
To hunt him till he fell;
He turned and fled into the dim,
And after him came hell.
–“The Hounds of Hell.”)
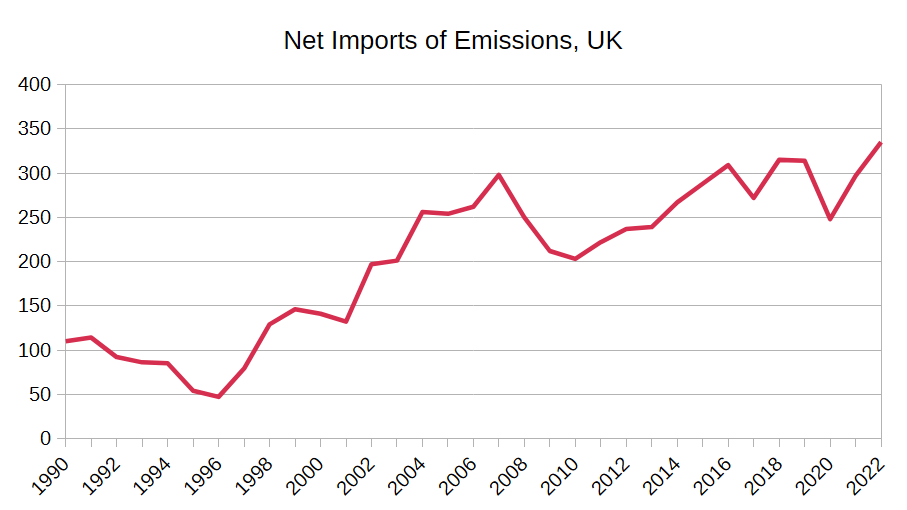
Anyway, after that diversion into poetry corner, we can now show the growing gap between the UK’s Consumption Emissions – i.e. our real impact on the atmosphere, however serious or not that might be – and our Territorial Emissions – the lower and rapidly-shrinking figure preferred by the “Lanyard Class”.
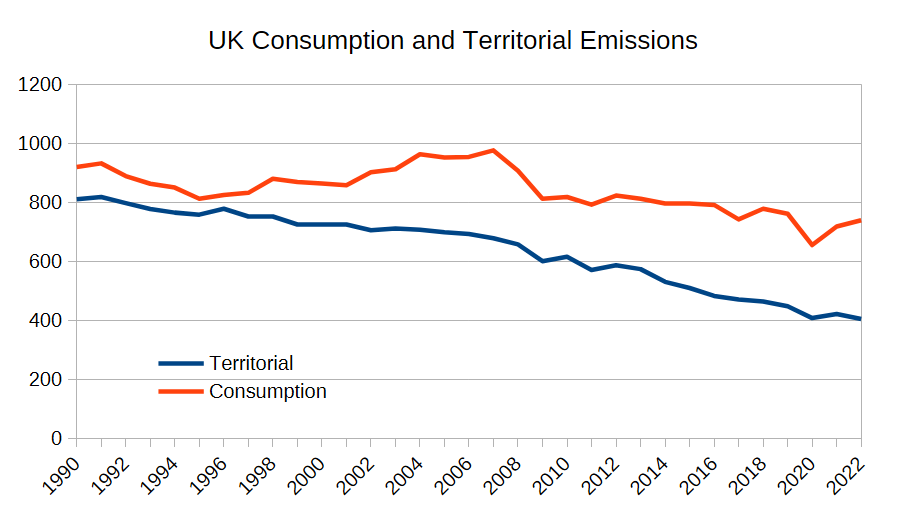
The growing gap between the two is a quantity called “Net Imports” – that part of our Consumption Emissions that we bring into the country from abroad. We Exported 69 Mt CO2 eq in 2022, and Imported 404 Mt, and as the figure below shows, the 2022 Net Imports totalled a record 335 Mt. Note that our Exports count against our Net Zero target: there is then a motive to reduce them. There are two ways of doing that. One is to reduce the GHG-intensity of manufacturing, or providing services. The other is to find ourselves outcompeted, so that our Exports are surplus to the requirements of other countries.
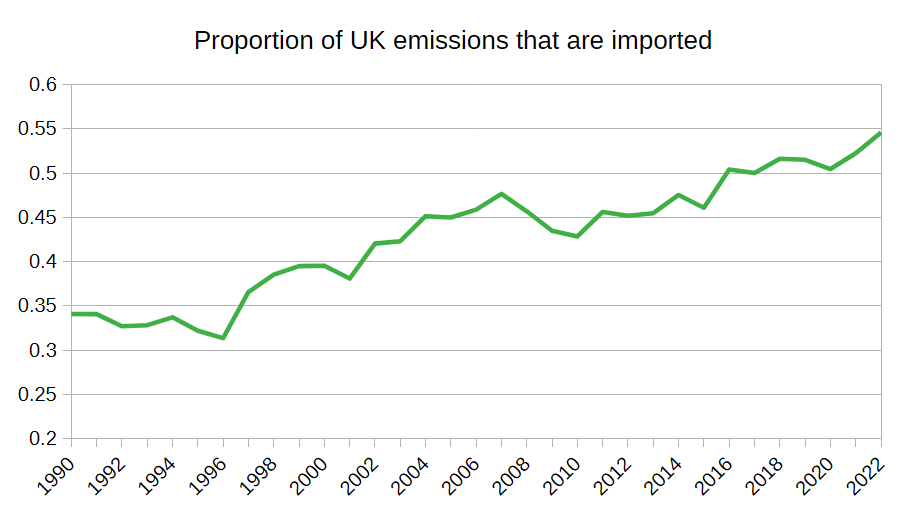
On the home front, we are now responsible for less than half of our own emissions, as this figure shows. It’s going well guys! We’re saving the planet, all right. Keep it up!
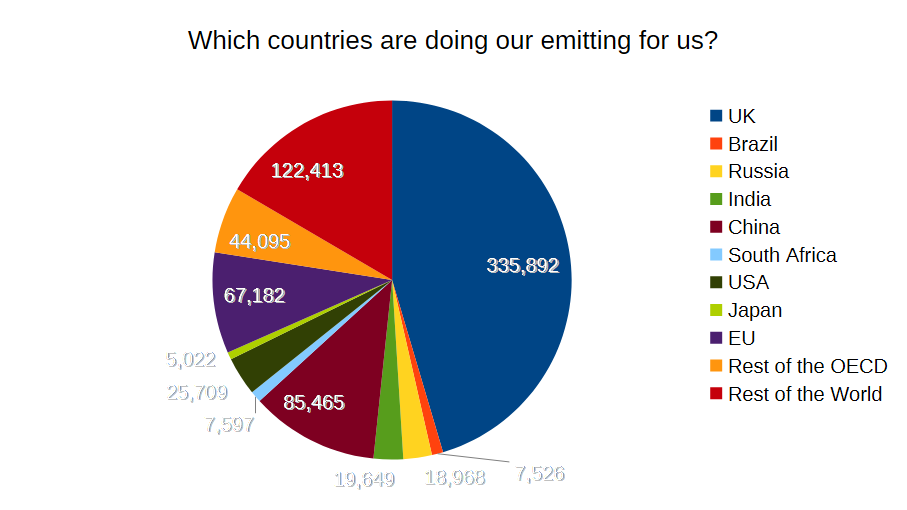
This Pie shows who is doing our manufacturing, etc, for us.
There should soon be an update with 2023 numbers. I’m sure, like me, you can’t wait. You can get the more detailed spreadsheet, with country and sector info, made by the University of Leeds (which produces Defra’s numbers for it), from here.

The growing consumption emissions graph illustrates the noisiness of a zombie economy. The falling territorial emissions graph illustrates the silence of the abandoned grave.
Ot have I got that wrong?
LikeLiked by 2 people
Ah but, Mad Ed has stated that a further 87% of CO2 emissions must be achieved……now without putting too fine a point on this, if we are importing nearly 50% of the GHG we are blamed for, obviously closing off ALL imports will make a major contribution in many areas- reduction in CO2, important reduction in the requirement to fund imports helping our “balance of payments” which will make up a creditor Nation as opposed to a debtor Nation, obesity will be eliminated as imports of foodstuffs will no longer be allowed, exports will be restricted to finance as no manufacturers will exist, all we then have to do to reach Nirvana is get rid off a minimum of 60,000,000 people and the result will be global salvation- Planet Earth saved by Saint Mad Ed, saviour and far sighted genius who discovered that if you manufacture nothing, make energy so expensive no one can afford it, make food scarce and very expensive so that it becomes a luxury, you can take GHG emissions to almost zero…….then it’s just a question of killing off the livestock who fart GHG.
Mad Ed will be responsible for Crimes against Sanity and taking a stagnant economy already on its knees and ensuring that people look back on the three day week, perpetual strikes, inflation at almost 30%, as a golden age while the Nations crumble into decay.
LikeLiked by 2 people
A wealth of great detail Jit, thanks. It was nicely covered by Dieter Helm in his recent article. For example: “Britain may have got out of domestic coal, achieved by the Conservative governments, but it has not got out of coal consumption embedded in imports. It is still 75% fossil-fuel-dependent.” And it’s touched on in – ahem – item 3.1 of my essay The Case against NZ.
LikeLiked by 2 people
Thanks Jit, common sense on display here, sadly lacking at DESNZ.
LikeLiked by 1 person
Jit; An excellent analysis, thank you. This deception, ignoring our imported emissions, is clearly a nonsense. It’s surprising that China doesn’t defend its huge emissions by pointing out that they are largely exported: the country is the workshop of the world, after all.
One question, do the numbers include power generation? While imports from France and Norway are zero-carbon, I suspect that there is a portion of gas- or coal-fired power coming from our other foreign suppliers (especially Holland since there is a chunky coal-fired plant located very close to their end of the interconnector).
LikeLike
Mike, that granular data must be in the hands of the University of Leeds so that they can build up their totals. But they don’t present it. Their detailed spreadsheet allows you to see consumption by sector or source country but not both together.
I wrote a paragraph here estimating the CO2 imports associated with energy, but it was wrong. This is the detailed spreadsheet from UoL, if you’d like to see it.
LikeLike
Noble Climate Science,
Because of its purpose,
Sometimes cooks the books,
In one case ‘ Hide the decline,
Or when necessary, do
the reverse.
LikeLike
How come these stats haven’t been updated beyond 2022, DEFRA?
https://www.gov.uk/government/statistics/uks-carbon-footprint/carbon-footprint-for-the-uk-and-england-to-2022
Still, what there is, is bad enough. Presumably it’s worse now:
LikeLike
Jit; Thanks for that link to the spreadsheet. I’m afraid my eyes glazed over after a few minutes. Also I am very dubious that emissions can be broken down reliably into so many sub-categories, some very small such as “veterinary services”.
I did notice that there is a marked difference between CO2 equivalent figures and straight CO2. In the UK’s case the CO2e number is nearly 20% greater than just CO2. To me that suggests their methodology gives an improbably heavy weighting to methane, NOx, etc..
LikeLike
Those MPs who backed the Climate and Nature Bill understood that Miliband is chasing the wrong target. Unfortunately, they didn’t understand the damage caused by the attempt to reach net zero as defined by the Climate Change Act (as amended). Had they got their wish, they would have returned the UK to the Stone Age.
LikeLike