Ecologists like to think they know good habitat when they see it. “Yep,” they’ll say. “That’s good habitat.” Or: “Nope, that has no wildlife value.”
As an ecologist, I do the same. Take me somewhere and I will form an opinion about the nature potential of a patch of ground in a few seconds. Will I be right, or not? Who knows. Will another ecologist agree with me? Ditto.
It’s all about feel, I guess, but you can’t deal in feel. You need a way of putting a number on things, giving habitat an objective value. An ecologist thinks he or she knows a good great-crested newt pond when looking at it. But can the ecologist say why the pond is good, or how much better it is than the one a hundred meters away? Is it possible to quickly measure things, with little or no experience as an ecologist, and come up with a viable answer as to how good the pond is compared to different ponds measured in different places on different days by different people?
Well, about 15 years ago an outfit called ARG UK (Amphibian and Reptile Groups) came up with a way of quick-scoring a pond for its suitability for great-crested newts. It’s called a Habitat Suitability Index, or HSI. Ten variables are assessed, and given a score from 0.01 (awful) to 1 (perfect) and you then multiply all ten together and take the tenth root of the resulting number. This gives you the HSI, a quick assessment of how good the pond is.
Now, about 3 years ago, I decided to create a similar way of rating electricity generators. It was to be a PSI – a Power Suitability Index. It would objectively compare different generators, to see how suitable each was to power modern civilisation. I decided to measure ten properties of electricity generators, give them a score, multiply them together, and take the tenth root. However, I couldn’t think of a valid way to get a set of scores that would be objective and immune to the accusation that a thumb had been placed on the scales, or the sub-indices, in order to get the outcome I wanted. My sub-indices were things like cost, capacity factor, and so on. So far so easy. But some sub-indices were harder to put a number on: variability, environmental impact, things like that. (We know wind is variable, but what score does it get? How predictable is that variability? Solar is somewhat more predictable, inasmuch as it never produces at night. Does offshore wind score higher than onshore for variability, or only capacity factor? Etc.)
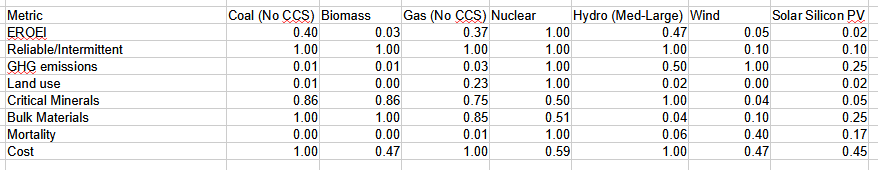
Anyway, I was easily deterred, but resolved to come back to the issue, but never did. Until today. David Turver has recently posted “Physics First Energy Policy” on the Eigen Values Substack, and included in that assessment is a table of data for eight different properties of electrical generators. I copied the numbers, I hope faithfully, into a spreadsheet:

Well, this set of data lent itself perfectly to my long-abandoned idea for a Power Suitability Index. There are only eight variables, and therefore eight sub-indices, so once all the sub-indices are multiplied together, you then take the eighth root, not the tenth. The scoring is simple enough. The “best” value at any of the variables gets a one. If a high number is good, then other generators get a score of the “best” value divided by their value. If a high number is bad, the other generators get a score of their value divided by the “best value.”
There is only one “questionable” score – where Reliable generators score one, what do Intermittent generators score? I’ve put 0.1 – but it could be unfairly low.
Here’s how the sub-indices are calculated:

And here are the resulting sub-indices for all the generators, to two decimal places:
What about the results?

Biomass is objectively the worst (because it benefits from scoring 1 for the reliability sub-index, but still loses) at a score of 0.06. Wind and solar PV are joint 5th, scoring 0.10. Coal in 4th scores 0.12, Hydro in 3rd has 0.24, Gas in 2nd scores 0.25, and winning by a country mile on this attempt at a PSI is nuclear, with a whopping 0.79 out of 1.
So there you have it. Should anyone have suggestions for other sub-indices, or for a different score than 0.1 for intermittent generators for the Reliability sub-index, I’m all ears. Some may argue with the figures that give rise to the sub-indices, or note that wind is not split between offshore and onshore, etc. But I tend to think that future tweaks will still result in the same winner.
/message ends

That’s a great idea, Jit. You’re correct that it’s open to accusations of lack of objectivity, but you have tried to be objective, you have tried to use relevant properties and factors, and it’s certainly no less objective (and in probability much more objective) than, for instance, stuff that’s produced by the Climate Change Committee or DESNZ.
I assume that the “deaths” criterion applies to human mortality. I wonder if the figures would change if the bat and bird shredding capacities of wind farms were taken into account? I also wonder how you measure human mortality? Not a very objective factor, albeit an important one when trying to assess the value and usefulness of different energy sources. Climate alarmists would no doubt score fossil fuels badly, adding the effects of heat waves to the figures (as well as the supposed, but possibly imaginary, declining crop yields they predict with climate change) on top of deaths from pollution; nuclear opponents might argue that the risk of a big nuclear meltdown with mass deaths from radiation should be included. I don’t have answers to these issues.
LikeLiked by 1 person
I’m not sure where the deaths stats come from. I presume the high value for coal is mostly derived from air pollution.
On bird deaths, there is unlikely to be agreement between the sceptic and the alarmist – remember Sovacool’s paper that assigned more bird deaths per GWh to nuclear and coal generators than wind power? [Discussed by me here.]
And yes, the meltdown possibility is always lurking in the popular imagination. I guess the data here already includes the casualties from the Chernobyl event.
LikeLike
Jit,
I can’t see any catastrophist agreeing with your approach. For them, any technology that contributes to global warming has a hand in enabling extinction. As such, there is no index that can be applied or square rooted.
LikeLiked by 1 person
That HSI looks decidedly wonky what with (a) the tenth root of a product equalling the product of tenth roots, and (b) the tenth root of 0.01 being about 0.6. If the 0.01 score was intended as a killer, it was not doing much of a job as all ten measures (and the final index) would sit between 0.6 and 1. Might just as well have averaged them with a rider for the killer case.
LikeLiked by 1 person
Max, I’m not sure what the statistical advantage of using a geometric mean instead of an arithmetic mean is. [I just copied the newt HSI.] Using an arithmetic mean, nuclear still wins, but biomass is no longer in last place – wind and solar are (solar last, wind second last). Coal, gas and hydro are close together in a joint-ish second place, biomass fifth.
LikeLiked by 1 person