So says the Institute and Faculty of Actuaries.
Every year.
Every year – at least for the last three, I haven’t looked further back – they produce a report that is a glossy, broad-brush, almost unreadable, partisan, hysterical fantasy tale of present and future climate-related risks.
This year: Planetary Solvency – finding our balance with nature
Thesis: The risk of Planetary Insolvency looms unless we act decisively. Without immediate policy action to change course, catastrophic or extreme impacts are eminently plausible, which could threaten future prosperity.
Last year: Climate Scorpion – the sting is in the tail
Thesis: The actuarial approach can be used for climate change. It begins by outlining how actuaries deal with extreme, ruinous risks, what this means for climate change, what we do and don’t know about the physical impacts, tipping points and social knock-on effects of climate change, and what actions we can take to manage the risk.
2023: The Emperor’s New Climate Scenarios
Thesis: Climate tipping points are a growing threat, and the solution to climate change has to be equally discontinuous. We need to “operationalise” positive tipping points.
All three are a fricassee of pretty diagrams and alarmist nonsense. You might expect actuarial science to be as dry as old bones, for numbers to be crunched unemotionally, rigorously, for data to tell all, and fantasy to tell nothing. Well, the things they put in their shop window show otherwise.
Take this comment from “Planetary Insolvency”:
For example, in The Emperor’s New Climate Scenarios a methodology based on a technique known as reverse stress testing suggests to ‘expect 50% GDP destruction – somewhere between 2070 and 2090’.
Does anybody seriously expect >50% GDP destruction? It is a ludicrous suggestion.
The source they refer to, their own Emperor’s New Climate Scenarios, says:
Put another way, at what point do we expect 50% GDP destruction – somewhere between 2070 and 2090 depending on how you parameterise the distribution.
Parameterise? Distribution?
This is the relevant figure from Emperor’s:

Where do these lines come from you ask? Here is their explanation:
A relatively simple log damage function could be used that assumes 100% GDP loss at a certain level of warming, say 6˚C, 5˚C, or 4˚C, although some may argue that even 3˚C would be extremely challenging to adapt to, and certainly sensitivities should be undertaken at all of these. Figure 9 above, adapted from analysis undertaken by Carbon Tracker, illustrates this, as well as comparing the output with the current quadratic damage function used by economists.
So the answer is: you create a logistic function that hits 100% at 4C, and then use that to show that in 2070 the world should expect a 50% GDP destruction. The curve itself has no basis in anything: it is a line plucked unceremoniously from an unmentionable orifice.
Why logistic? Why not exponential? I fear our actuarial alarmists are missing a trick here. Why should the damage slope start to level off after it reaches 50%?
Yes, Jit, I hear you say in your most soothing voice, desperately trying to gently calm the agitated patient. But this is just an illustration. It’s a scenario, just put there to facilitate discussion. It’s not an actual attempt to model anything. No-one really believes it.
Except the Institute and Faculty of Actuaries do, as they made clear in the press release accompanying this year’s dose of claptrap:
The global economy could face a 50% loss in GDP between 2070 and 2090, unless immediate policy action on risks posed by the climate crisis is taken.
I’m not going to dwell on these reports – I don’t think they deserve it. But I will pull out a few things from the most recent. Ya know, things that caught my eye as I skimmed down the page, waiting for it to get better.
Word of the report: “polycrisis,” which has four uses, apparently none of them ironic.
Their Figure 9 shows that under a tipping point of AMOC collapse and 2.5C of warming, the Antarctic Peninsula will be suitable for growing wheat:
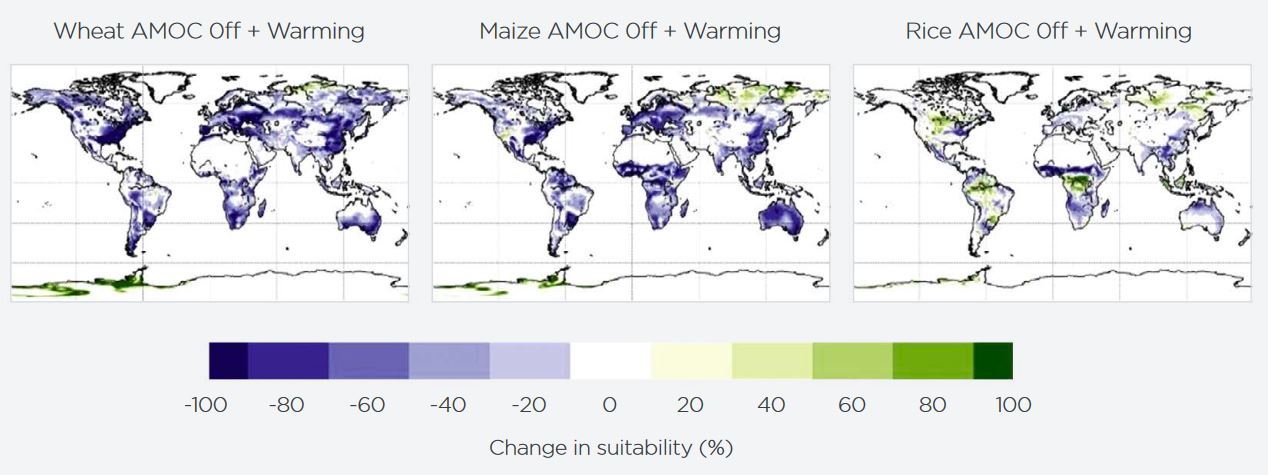
However, it looks as if nowhere else in the world will be. The magic of tipping points! Crank up that alarm, go on. Ah, but it’s just a scenario. Just an illustration. No-one really believes it might happen. But they do, as the report makes clear:
Some scientists estimate there is a 45% chance of a collapse in key ocean current circulations, possibly as early as 2040, which is ‘unignorably high’. Impacts would include significant reductions in the northern hemisphere in staple crop-growing capability.
For Climate, the risk matrix they provide gives a “highly likely” chance of “limited” to “severe” impacts in 2025 – i.e., now.

Highly likely means >90% chance; as to the impacts themselves, see their risk matrix:
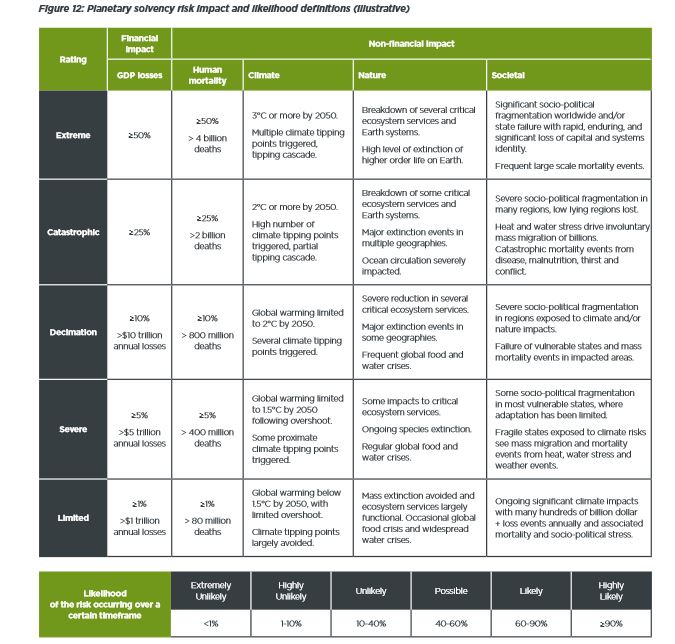
So, it’s terrible now. But by 2050, we’re into >50% mortality fantasy apocalypse land. I know! I exaggerated in the title. We’re not all doomed. Only half of us are.
And finally, especially for our resident Black Swan aficionado John R, I present a figure (from 2024’s “Scorpion”) that seems to imply that the tails of a parametric distribution are Black Swans.

Featured image: the webcam at Longyearbyen Harbour this morning. The BBC were today telling us how worried they were that Svalbard has been so unseasonably warm this early February. [In a story about record-low sea ice extent globally.]

Webcam link: https://portlongyear.kystnor.no/
LikeLiked by 1 person
The idea that they are an objective and reliable organisation on the subject of climate change is for the birds. See this:
https://actuaries.org.uk/climate-change-statement/
and this:
https://actuaries.org.uk/media/h44pfpzi/climate-change-guidance.pdf
Their reports were cited by some of the more climate concerned Lordships during the House of Lords debates that I reported on at Cliscep a while back. They are a useful reference source for anyone who wishes to claim that if we don’t do something about climate change it will cost us a fortune and everything will go to hell in a handcart. Try this also:
https://actuaries.org.uk/thought-leadership/policy/100-year-life/intergenerational-fairness/issue-1-climate-change/
In this issue, we consider the role of discount rates, financial disclosure and the importance of understanding not just the likely possible outcome, but the worst case scenario when assessing the potential impact of climate change.
And there was me thinking that the job of actuaries was to assess in a realistic way things like the age-profile of pension funds to assess the level of finance needed to ensure a pension fund is fully-funded. How naive can I be? When it comes to climate change, apparently it’s the worst case scenario we have to consider.
LikeLiked by 3 people
JIT, what you are demonstrating is the new norm of ridiculous representation. Here is a typical example of the nonsense officialdom produces. Manual Met Office weather stations are read at 9:00 am daily. The “hottest” recorded daily temperature is likely to be in the afternoon of the previous day (though not always by any means) so the Met Office always predates the reading to the previous day. Okay, but after the 31st December the Met Office starts a new calendar year which prohibits this “data throwback” in archives for the January 1st reading ….so how do they get around this? Ready?….They use the otherwise “throwback” reading from 1st January for the archive records as if it is for the 31st of…..January. They then reset the rest of the year’s readings by IGNORING the throwback of the 1st of February. Confused and bewildered? So you should be.
LikeLiked by 2 people
They may right when they foresee a 50% drop in GDP:
https://rclutz.wordpress.com/wp-content/uploads/2024/02/zero-emissions-kill-economy.png
LikeLiked by 4 people
Ron Clutz, consistently excellent, pegs it. The climate hype is the danger.
LikeLiked by 1 person
What more and more Americans are realizing is that outrageous anti-reality pap is frequently subsidized by NGOs laundering money for corrupt government bureaucrats.
LikeLiked by 1 person
Jit,
“I present a figure (from 2024’s “Scorpion”) that seems to imply that the tails of a parametric distribution are Black Swans.”
Absolutely it does. It is not implied, it is stated quite explicitly when they say “Tail risk or Black Swan events that were in the tail of Distribution 1”. But the really weird thing is that there seems to be at least one person on the authorship team who knows this to be incorrect, since earlier on the document says “The term ‘black swan’ is sometimes used to refer to an event that was not imagined within the range of modelled outcomes”. The same informed person seems to be fighting with the idiot who labelled the tail of Distribution 1 in Figure 1, because this is said when labelling the tail of Distribution 2: “…anyone using Distribution 1 will see these as ‘Black Swans’ when in fact their model may need updating”. They are pointing out that anyone who experiences the Distribution 2 tail events whilst using Distribution 1 will see them as black swans — which is true.
Confusion reigns. Perhaps somebody should have been given the job of ironing out such inconsistencies.
I once got into an argument on this website with someone who seemed convinced that the term ‘black swan’ was perfectly okay when referring to the low probability, high impact upper end of a calculated distribution. I suggested that somebody who could make such a basic error is not to be trusted with the nuances and complexities of uncertainty and risk analyses. Could this be true of the Institute and Faculty of Actuaries? Surely not! I’ll spend some more time later today reading their document and will get back to you with my verdict.
LikeLiked by 2 people
A logistic is used to model cases where you increasingly run out of things that can go wrong, hence an initial build up to a peak rate of rise followed by a tailing off. Its mathematical derivation assumes the rate at which things go wrong is proportional to the amount of things yet to go wrong. An exponential rise would presuppose there’s an endless supply of new things that can go wrong.
LikeLiked by 1 person
Thank you Max. The logistic is also one of the first equations to learn when studying population biology. There is a famous example by Raymond Pearl from a century ago showing the growth of a population of yeast following such a curve. Link: https://www.journals.uchicago.edu/doi/pdf/10.1086/394288
In biology the reasoning is similar, in that there are fewer and fewer available resources to scramble for as the population grows.
But I would have thought that the alarmists would prefer the idea of a runaway collapse of Earth’s systems.
LikeLike
So I’ve now read Climate Scorpion – the sting is in the tail.
The very first thing that struck me was the introductory endorsement given by Professor Johan Rockström, Director Potsdam Institute Climate Impact Research. It is that institute’s founder, Joachim Schellnhuber, who is fond of saying that we shouldn’t listen to the IPCC because it is not sufficiently focussed upon the worst case scenarios. According to him, you would be much better off listening to those who operate on the fringe of climate science – or maybe those who are not even climate scientists. So we have a group of actuaries who are taking their scientific advice from people who are holding a deliberately extreme position unshared by the scientific consensus. It is no surprise, therefore, that the document is full of fat-tail and black swan catastrophe porn.
That said, I saw little to take issue with when it came to the risk management technicalities (other than the black swan gaffe, of course). I was struck, however, by their attempt to sell it all as some new revolutionary approach that only an actuary can bring to the table. They sum up this revolutionary idea as “we need to have a best guess about the worst case and make policy on that basis.” But this is just bog standard precautionary principle stuff. As I’ve said many times before, it is all very well applying this principle just as long as you do so in the solution domain as well as the problem domain. I see no sign that the authors appreciate the importance of this, but I haven’t read their other stuff yet.
One quote that I found interesting was this: “A rule of thumb for risk modelling is that when uncertainty is high, simple models tend to be more helpful than complicated ones.” That probably explains a lot regarding the simplistic graphs found in the document. The actuarial approach, it seems, can be high on principle and low on detail. As for the logistic versus exponential trends, I think Max makes a good point but we shouldn’t overlook that much is made in the document of the interconnectivity of risk and ‘risk cascades’, which would seem to suggest exponential developments.
LikeLiked by 2 people
Thank you John. Regarding the black swan figure, I’m still puzzling over it. It makes no sense to me. Letting slide the blatant mistake of labelling the tail of the first distribution as a black swan, I’m still not clear that the tail of the new distribution is a black swan either.
Perhaps they chose the wrong variable as an illustration & that is what is confusing me. I do not understand how or why the severity of floods should follow a distribution something like a normal (or in the second distribution, a skewed normal). The frequency of rainfall events does not resemble that, nor anything like it, and rain causes floods. An exponential function would feel better.
Then, knowing that such events as floods are dominated by outliers already, there is the question whether such a distribution is a valid model at all.
Then there is the issue that rain and the flow of water is quite well understood, so that the climate projectionists are quite capable of predicting enormous future deluges because of altered storm tracks and/or warmer air’s ability to hold more water (as they constantly bang on about – but I haven’t seen it explained why all that water should fall out at once). (When they cite this about floods in the UK that inevitably take place in the colder months, I do wonder about the logical consistency of deploying it as an argument).
If a climate scientist has predicted it, can it be a black swan?
LikeLiked by 1 person
Jit,
“can it be a black swan?”
Obviously not. Even risks associated with posited tipping points do not qualify, basically for the very reason they had been posited. It is the tipping point that no one thought of that qualifies (or the one that happens earlier than had been thought possible). As for the use of simply formed distributions to capture risk profiles, I hope that my reservations are well known by now. Uncertainty is not so easily captured when it runs deep.
I think the tail risks in Distribution 2 can turn out to be black swans, but only for those who believed in Distribution 1.
LikeLiked by 1 person
As soon as I saw the name Tim Lenton in the list of authors, I knew what this was all about – Lenton’s obsession with pseudoscientific ‘tipping elements’, ‘tipping points’ and ‘tipping cascades’. All of the climate risk scenarios from severe to extreme involve the activation of mythological climate tipping points (e.g. AMOC shutdown) which have virtually no basis in observational data or sound science. Lenton has been plugging his ‘tipping points’ since 2008 at least and his ambition is to persuade the IPCC to do a Special Report just on Climate Tipping Points.
This explains why the BBC was so desperate to keep alive the AMOC shutdown scare story recently, just a week after it had basically been comprehensively debunked in the scientific literature. Got to keep the scary climate tipping points pseudoscientific narrative going, especially as the climate changed extreme weather narrative has been flagging recently.
https://jaimejessop.substack.com/p/the-amoc-catastrophism-wheel-of-rebirth
LikeLiked by 4 people
It’s no coincidence that Lenton was quoted in that latest BBC article on the AMOC shutdown scare:
Lenton is a signatory of that Open Letter and he authored Reference 3, cited therein – ‘Global Climate Tipping Points’, 2023. Climate alarmism and the Net Zero grift is an incestuous circle jerk of activist charlatans masquerading as scientists, plus politicians, captured institutions just like IFoA and Exeter University, plus craven mass media organisations.
LikeLiked by 3 people
How coincidental. BBC Politics tweeted this only this morning:
https://x.com/BBCPolitics/status/1891073187590320276
The Grift goes on. ARIA (Advanced Research and Invention Agency) is going to be hoovering up 80 million quid to study mythological ‘tipping points’.
We need DOGE UK.
LikeLiked by 1 person
Johan Rockström invented the planetary boundaries notion promoted by above Latest diagram from Stockholm Resilience Centre
https://rclutz.com/2023/09/17/dont-buy-planetary-boundaries-hype/
LikeLiked by 2 people
Jit: Re shape of flood severity distribution. We river flood hydrologists mostly quantify “flood severity” using the peak discharge (in m^3/sec) measured at a point on a watercourse. The series of annual maximum peak discharges are then often fitted to the Gumbel Distribution or one of its heavy-tailed extreme value relatives. The Gumbel distribution’s coefficient of skewness is 1.14 so Distribution 1 diagrammatically is not so wide of the mark.
Confounding factors like soil catchment wetness, storm duration, and catchment coverage totally mess up any simple statistical relationship between causative rainfall and flood frequency distributions. An obvious mismatch is that the heaviest rainstorms occur as summertime convective events while fluvial flooding is much more often than not a winter event.
Distributions 1 and 2 completely fly in the face of IPCC WG1 which found no evidence of trend in their summary of the huge body of research looking into the issue.
While the term “Black Swan” is only a metaphor I agree that it would conventionally be used to describe an event way outside the general run of experience. So it would be depicted as a point way off to the right of the curves shown in the diagram.
LikeLiked by 1 person
Thank you Max. I was thinking that since flood events had to be a subset of all events and that a threshold must then apply (the majority of the time the river stays in its course), the curve ought to be of a different form (like an exponential). My thinking, in other words, was that if all flows over the course of a year have a normal-ish form, then a large chunk of the left hand side of that curve should be discounted, as not measuring a flood, but normal flows.
I know nothing about hydrology – the closest I have come was when investigating the dissolved organic carbon outflows from English peatlands ten years or more back.
LikeLike
Indeed, peak flows over a fixed threshold will exhibit a mode to the left and an exponential-type decay into the right tail. Furthermore, an exponential distribution of threshold exceedances combined with a Poisson distribution of occurrence will converge to a Gumbel distribution of period maxima. And this has been used as an alternative approach to flood frequency analysis.
Did you encounter Phil Ineson in your DC from peat days? In my time he was at the Institute of Terrestrial Ecology at Merlewood and set up an experiment at Great Dun Fell transposing peat cores to different elevations to simulate different temperature regimes. This was done within a global environment change programme I managed in the 1990s. The overall finding has been that warming did not affect the loss of dissolved carbon from peat, an important piece of information for water supply in the North.
LikeLiked by 1 person
Jaime Re ARIA: I recommend a visit to their 2023-24 annual report to really get you riled up. Stuffed full of inclusivity with nary a mention of a funded project. I guess they’re all like that these days.
LikeLike
Thinking about that “Black Swan” thing. John Arlott was a wizard at cricketing stats coming up with such phrases as “never before two sixes off the first over after tea on the third day of a Headingly test”. Was he describing a Black Swan event? Not really as this was just a juxtaposition of individually ordinary events. But what if the balls had landed on the same spectator’s head. I reckon that would qualify; the difference being that one conjures a malign finger pointing from the sky turning something explicable into something noteworthy.
The worst river flood disaster of my lifetime in Britain was the Lynmouth flood, several times larger than anything before, at least in folk memory. But this too was explicable in terms of the particular meteorological condition and 8 inches of rain is not totally unknown somewhere. A generation later we had Boscastle, not that far away and floods of this type occur almost routinely in one valley or other in South France and Italy following an “Episode Méditerranéen” . As a meteorological phenomenon this is something that happens most years but of limited spatial extent on landfall. Their Black Swan-ness emerges from a rare juxtaposition with an inhabited valley. However there are a lot of valleys stretching back from that long coastline with the right topography to convert the storm into a river flood, and a village in just the wrong place.
The Italians are best at bringing these events to heel at least as far as a statistical description is concerned. They use a probability density model built up from a component for the general run of flood events and another, parameterised regionally, for the “outlier” or Black Swan series. As far as what can be done about it, I suspect they mostly have to be lived with as the cost of protection would be prohibitive if applied across the board.
LikeLiked by 1 person
Max,
The most important thing to appreciate regarding black swans is that they are epistemological phenomena, i.e. they lie outside of the set of possibilities allowed for by whatever model of reality one is working with. That, of course, makes them highly subjective. It also means that they cannot be spoken of as a future possibility, no matter how remote (except of course as a general concept). Instead, they are not spoken of at all – until they happen! Then they are easily rationalised as something that we should have foreseen. But the fact is that gaps in our knowledge had rendered such foresight impossible. So yes, a black swan is a statistical outlier, but it is so much more than that. In Nassim Taleb’s own words:
The key phrase for me is “nothing in the past can convincingly point to its possibility”. For that reason I would also discount the same person being hit as being a black swan. The possibility was established the day that cricket was invented. Likelihood? Well that’s quite a different issue.
LikeLiked by 1 person
Ron,
Planetary boundaries, like any other boundaries, are very easy to draw and much more difficult to defend. Perhaps Rockström could start by defining what he means by ‘safe’ when he says ‘safe operating space’. Then he and I could start a debate, on the understanding that my background as a functional safety analyst steeped in the practicalities of establishing safety policies places me in the position of being the expert in the room.
LikeLiked by 1 person
Hello Max. Regarding Phil Ineson, I have never met him, but have cited him in reports, that’s for sure.
LikeLike
Re Black Swans: That sounds really restrictive. If I understand you correctly, even having the temerity to imagine the unimaginable already disqualifies it as a Black Swan as it can’t have been truly unimaginable in the first place for one to have attempted to imagine it (if you get my meaning).
I would have classified what I used to do as a flood hydrologist as at least Black Swan-ish when developing a flood scenario for designing a dam spillway or protecting a nuclear installation. The accepted technique was to construct a hypothetical flood input by combining worst of experience storm and reservoir catchment characteristics. The elements going into this process are individually just at the boundary of credibility, and their juxtaposition is what takes them into realms beyond. Other participants in the exercise, for example dam integrity or reservoir side-slope stability would have comparable criteria for their aspects of the scheme design.
One can conceive of cosmic events, human carelessness or sabotage as non-engineering threats but still imaginable even if not actionable. This probably sounds a bit banal alongside your philosophical standpoint.
LikeLiked by 1 person
Max – great to hear your experience with flood hydrologists & thoughts/comments.
In the UK MSM we, in last few years, seem to hear/see more rivers busting banks (man made channels?) & flooding houses/etc. The only answer seems to be “flood defences” which seem to fail when a Swan hits them.
Any thoughts re flood plains/urban living next to a river?
LikeLike
Max,
No I don’t think it is a question of what can be imagined, but what is plausible given the current body of knowledge. Somebody who ‘understands’ that all swans are white can still imagine a black swan, but their model of reality disallows it. That said, I admit that I’ve wondered whether a lack of imagination plays a role in defining that model. As I’m sure you are well aware, a group of engineers performing a hazard analysis can conjecture the possibilities until the pink cows come home, but there comes a point when an agreement has to be made to stop. This is where the concept of plausibility comes in, such that they then budget for the worst case plausible event. If we don’t set such a limit, then we run the risk of being bankrupted by our imagination. But what if the model upon which these calculations are made is incomplete without anyone knowing? This, I believe, is where the black swans reside. It is what the IFoA referred to as model risk. The risks that the model is designed to identify are quite different in nature to the risk that the identification itself is flawed. As I was very fond of saying, the risk that bites you in the bum is so often the one that is not in your risk register. Would it be something that could have been considered? With hindsight we will always say so.
When all is said and done, when it comes to risk management, practicality has to be our guardian. But when I look at net zero, I find it hard to persuade myself that this principle is being followed.
LikeLiked by 2 people
From a layman’s perspective, would a Black Swan be one of Rumsfeld’s unknown unkowns?
LikeLike
It is but a metaphor (somewhat ruined by the discovery in Oz of real ones) so I guess one cannot be too precious about a strict definition. Like Macmillan and his “events, dear boy, events”, the political world he and Rumsfeld occupied certainly seems to have a limitless capacity to throw up surprises, much more so than in my more linear world of engineering risk where Blackish Swans are just a long way out on a recognisable limb rather than along a previously unrecognised limb. The main difference is “people”, individually and severally, and their clashing interests that account for the relative richness of political Black Swans. At least that’s how I see it.
LikeLike
“… we run the risk of being bankrupted by our imagination.”
I like this expression. Surely this is where hundreds of climate scientists desperately seeking tipping points leads.
LikeLiked by 2 people
Max,
“I guess one cannot be too precious about a strict definition”
I’m not sure what you mean here by a strict definition. The definition I supplied was the one provided by the guy who invented the concept. He clearly wanted to draw a distinction between tail risks embodied within a defined distribution and those risks that are not covered by said definition, i.e. the risks associated with using the wrong distribution. I think that it is a distinction worth respecting, since it has pragmatic consequences. By the same token, I think the distinction between incertitude and variability is worth respecting, as is that between risk aversion and uncertainty aversion. These concepts are often conflated, but never to any advantage.
That said, there are a lot of people already who are satisfied using the term ‘black swan’ to mean any event that was unexpected due to its presupposed unlikeliness. Sooner or later, this will become the ‘strict definition’, despite my tears.
LikeLike
Jit, is this the sort of thing you mean?
“Early warning system for climate tipping points given £81m kickstart
Ambitious UK project aims to forecast climate catastrophes using fleets of drones, cosmic ray detection, patterns of plankton blooms and more”
https://www.theguardian.com/environment/2025/feb/18/early-warning-system-for-climate-tipping-points-given-81m-kickstart
…The UK’s Advanced Research and Invention Agency (Aria), which backs high-risk, high-reward projects, has awarded £81m to 27 teams. The quest is to find signals that forewarn of the greatest climate catastrophes the climate crisis could trigger. Tipping points occur when global temperature is pushed beyond a threshold, leading to unstoppable changes in the climate system.
The programme focuses on two tipping points thought to be at very high risk of being triggered: the collapse of the Greenland ice sheet, which would lead to a huge rise in sea levels, and the collapse of crucial ocean currents in the north Atlantic, which would cause global changes in rainfall and severely damage food supplies.
Scientists have already detected signals indicating that systems such as the Amazon rainforest and the west Antarctic ice sheet are becoming less stable. But researchers are unable to make useful forecasts of when a tipping point is likely to be passed...
LikeLiked by 3 people
John: “definition I supplied was the one provided by the guy who invented the concept” Sorry; didn’t properly register that. I thought people had been saying it for ever as a conversational gambit.
LikeLike
dfhunter: For sure the MSM peddle the tale that nature is throwing up more and worse river floods. IPCC WG1 have hit that one on the head, but as we know here, that’s no impediment to a good scare story if it buttresses a nonsensical policy agenda and gets their readers’ sanctimony juices running. Roger Pielke is the go-to man for that. For obvious reasons flood defences designed for protecting urban areas are not built to the ultra-high standard of a dam spillway – maybe 50 or 100 year return period. An overtopping 51 or 101-year flood is bound to happen so would not merit the Black Swan soubriquet. It could be rolled out though by the promoters who responded to the “never again” clamour with oversold promises.
Flood plain development should be judged on a case-by-case basis with a bias towards “don’t” but is not unthinkable.
LikeLiked by 2 people
Max,
“Sorry; didn’t properly register that”
Then I must apologize for not having made that clearer.
Can I just add that it has been a pleasure to have had the opportunity to discuss such issues with someone who was capable of intelligently challenging my assertions without resorting to aggressive rhetoric — unlike some who I could mention.
LikeLiked by 2 people
Mark, I’m going to go out on a limb and say they are going to find worrying evidence of rapidly approaching potential tipping points.
That, and that the tipping points will not happen.
Who’d want to be part of one of the 27 teams that didn’t find any indication of imminent catastrophe? You’d be out of a job the next grant round. [Sorry, that is rather cynical of me.]
LikeLiked by 2 people
Ref John R of 10:21 A couple of points arising:
Knowing when to stop piling risk on risk. There’s a reputational risk which tends towards gold plating. Less of a problem with Black Swan failure as the designer can wriggle out of responsibility.
Practicality as guardian. Clearly net zero fails this on every dimension. Which begs the question, what is it that is trumping practicality? There’s an element of the above – reputational risk. But bien pensant urges top my list – mankind a blot on the face of the planet, and look see how much I care. Plus a large helping of physics envy coupled with a tiny helping to the point of absence of any sense of proportion.
LikeLiked by 1 person
I am enjoying the contributions of Max Beran to this discussion particularly on nature throwing up more and worse river floods.
dfhunter wrote:
In the UK MSM we, in last few years, seem to hear/see more rivers busting banks (man made channels?) & flooding houses/etc.
Another factor in “worse river floods” is hydrological persistence. References to probabilities such as 100-year events are correct in flood frequency analysis but floods often occur as clusters of events rather than being completely independent. So there may be a number of years with significant floods occurring every year or so on the same river followed by a quieter period.
LikeLike
MikeH,
“From a layman’s perspective, would a Black Swan be one of Rumsfeld’s unknown unkowns?”
Essentially, yes. There are risks that are characterised by a range of potential outcomes, each of which are sufficiently well-understood to enable a quantification of both the likelihoods and the impacts. These risks are both known and calculable. Then there are risks that are posited upon eventualities that cannot be ruled out given the information available, but the information is insufficient to quantify the scale of risk (usually because probabilities cannot be calculated). These are known risks that are not calculable, e.g. a potential climate tipping point. Then there are the risks that simply fall outside of our current state of understanding. Not only can we not calculate such a risk, we can’t even envisage it because “nothing in the past can convincingly point to its possibility”. These are unknown unknowns, aka black swans.
Max,
I’m sure that the IFoA would argue that their approach is highly practical, at least as far as risk assessment goes. After all, they are actuaries who deal with this sort of assessment on a daily basis in order to inform practical decisions. But we have to examine closely just how their argument goes. They are suggesting that their approach can deal with both the incalculable risk and the unknown one. This follows simply because they presuppose the impacts to be catastrophic. You don’t really need to know the probabilities to know that a risk should be avoided at all costs if everything is at stake. You can even say the same regarding the unknown unknown, as long as you are conjecturing an existential outcome (how you avoid an unknown unknown is an interesting subject). That’s basically the precautionary principle they are using (although admitting to the employment of that principle, by name, seems to have gone out of fashion). If you are emboldened by scientists who are telling you that the science is strong enough to entertain a ruin scenario, then what are you waiting for? Just get on with it! Avoid that risk at all costs. Any other decision would represent the height of impracticality.
You can get away with this sort of logic as long as one applies it only to the problem domain, i.e. the physical risk of climate change. But as soon as one starts dealing with the solution domain, and its transition risks, things change radically. Oh no they don’t, reply the actuaries. What transition risk could lead to a 50% loss of GDP? Well if we are going to trade conjectures, where do I start?
LikeLiked by 2 people
Max B & John R: thanks for those explanations. It’s good to know that there’s a lot of serious science behind assessments of risk, etc. (even if I don’t understand much of it!). Unfortunately the media and public seem to have little or no appreciation of probabilities and so on. Many years ago I worked in nuclear power which was always fighting scare stories based on the idea that if something could theoretically happen, then it would happen.
LikeLike
Potentilla: Three points really. First the stochastic one that some degree of clustering is a feature of randomness. If events along the time line avoided each other then one would have to posit some force or process keeping them apart. But what if the clustering was not of this Poissonian form? There certainly can be carryover processes such as major storages above or below ground that would predispose a river to be prone to experiencing high flows occurring in clusters. A chalk stream for example is fed from groundwater and if the water table is close to the surface due to prior raininess it will remain that way over weeks and months, even a few years as the volume of water stored is large compared with the rate of its depletion. The same or similar applies to soil moisture when at or close to saturation. In UK conditions the state of the soil is highly determinant of a catchment’s response – how much of the input rain appears as output river runoff in short order – which is of course why floods occur more in winter even if the intense rainstorms are more a summer event. This would contribute to within-year clustering predisposing a large runoff response fraction so long as the soil remained wet.
The nature of macropore flow through the soil is not well understood but it does appear from tracer experiments that some portion of a previous storm remains poised as it were in the soil interstices (if continuity is lost) ready to be pushed out more easily by a following rain input thereby increasing its response (|in terms of what fraction of the rain input appears in short measure as output runoff). Much of the runoff that appears in the peakiest part of a flood emanates from the neighbourhood of its tributaries rather than by contributions from the entire catchment area.
But perhaps you refer to multi-year clustering. In most cases they will have a meteorological origin, not a hydrological one. AMOC, Ninos, Ninas and their kin contribute to weak but still observable signals of cyclicity at that level. Decadal fluctuations are also known but beyond my ken; the Earth System is replete with flywheels of large and small inertias, especially in the ocean.
As a nerdish coda, when we talk about a 100-year flood – eg the 100-year flood is 50 m^3/s – that is strictly speaking a statement about a year, more than it is about a flood. It is saying that any given year stands a 1 in 100 chance of experiencing a flood peak exceeding 50 m^3/s. It does not preclude there being multiple events of that magnitude in the same year. The timeline has only the one tick per year. Apologies if teaching grandma etc.
LikeLiked by 1 person
Mike H,
I don’t have any experience of working in the nuclear industry so I shouldn’t really comment. My background was as a functional safety analyst working in road transportation. Consequently, my thinking on the subject was influenced by the systems approach to dealing with uncertainty, as expounded in papers such as this:
“System Theoretic View on Uncertainties”
https://arxiv.org/pdf/2303.04042
In the systems framework the uncertainty we are talking about here (the unknown unknown, or black swan) is referred to as ontological uncertainty. It is the third of a triumvirate: Aleatory, epistemic and ontological. The above paper describes it thus:
LikeLike
Max – extract from your above comment –
“A chalk stream for example is fed from groundwater and if the water table is close to the surface due to prior raininess it will remain that way over weeks and months, even a few years as the volume of water stored is large compared with the rate of its depletion”
I seem to remember the BBC linking/blaming dried up chalk streams to climate change (may be wrong, can’t find a direct quote). But did find this –
River Ver: Nearly half of chalk stream has run dry – BBC News – partial quote –
“John Pritchard, from the Ver Valley Society, said that while the dried up river in the Redbourn area is “upsetting enough”, it also means less water is coming down the river, leaving the city of St Albans with “a warm, slow flowing, silty chalk stream”.
“It’s the result of a number of things,” he said, “some climate change, but it doesn’t help that we’ve got nearly 10 million litres a day of water being extracted from upstream.
“So when the river’s in a bad state, it would be beneficial if that water was coming back to the environment.”
LikeLike
I’ve just realised that I have been giving the IFoA far too much credit by suggesting that they are employing the precautionary principle. I had forgotten that their risk matrix had portrayed a catastrophic climate outcome by 2050 as being ‘highly likely’. As such, they are employing the ‘hysterical is best’ principle. It’s the same principle that results in piles of crushed corpses at the fire exit after someone has shouted ‘fire’.
LikeLiked by 1 person
dfhunter: Interesting though the topic is, it’s a long way from Black Swans, tipping points, and the red end of the IFoA risk matrix.
LikeLike