The IPCC AR5 Report included this diagram, showing that climate models exaggerate recent warming:
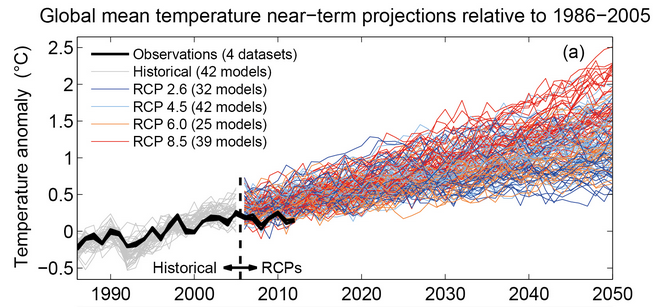
If you want to find it, it’s figure 11.25, also repeated in the Technical Summary as figure TS-14. The issue is also discussed in box TS3:
“However, an analysis of the full suite of CMIP5 historical simulations (augmented for the period 2006–2012 by RCP4.5 simulations) reveals that 111 out of 114 realizations show a GMST trend over 1998–2012 that is higher than the entire HadCRUT4 trend ensemble (Box TS.3, Figure 1a; CMIP5 ensemble mean trend is 0.21°C per decade). This difference between simulated and observed trends could be caused by some combination of (a) internal climate variability, (b) missing or incorrect RF, and (c) model response error.”
Well, now there is a new generation of climate models, imaginatively known as CMIP6. By a remarkable coincidence, two new papers have just appeared, from independent teams, giving very similar results and published on the same day in the same journal. One is UKESM1: Description and evaluation of the UK Earth System Model, with a long list of authors, mostly from the Met Office, also announced as a “New flagship climate model” on the Met Office website. The other is Structure and Performance of GFDL’s CM4.0 Climate Model, by a team from GFDL and Princeton. Both papers are open-access.
Now you might think that the new models would be better than the old ones. This is mathematical modelling 101: if a model doesn’t fit well with the data, you improve the model to make it fit better. But such elementary logic doesn’t apply in the field of climate science.
The main “feature” (bug?) of the new models is their high climate sensitivity. Recall that the IPCC says that equilibrium sensitivity is 1.5 – 4.5C, a range that hasn’t changed in 30 years. The Met Office paper comes up with a figure of 5.4C, and the GFDL group say about 5C, so they are both way outside the IPCC range. Of course, the useful idiots in the media are lapping this up and saying that the earth is warming more quickly than thought, which of course isn’t even what the papers are claiming.
Given that the previous models were running too hot, as shown in the IPCC graph above, and the new ones have a much higher sensitivity, the obvious question is how well do the new models do at reproducing the 20th century? Well, you have to wade through the UKESM1 paper to find the answer to the question, but eventually you get to this in figure 29, showing the new model compared with HadCRUT4 from 1850 – present:
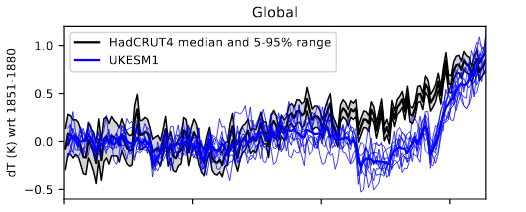
(The GFDL paper has very similar graph in fig 12). The model shows recent warming that is vastly greater than the observations. Clearly the model is far too sensitive. So what do the authors of the paper say about this? Believe it or not, they claim this, right at the top of the paper in the “key points” section:
* UKESM1 performs well, having a stable pre-industrial state and showing good agreement with observations in a wide variety of contexts.
They then repeat this falsehood in the abstract, claiming good agreement exactly where the agreement is particularly bad:
Overall the model performs well, with a stable pre-industrial state, and good agreement with observations in the latter period of its historical simulations
and then repeat it yet again in the “plain language summary” below that. Presumably this lie is designed to be regurgitated by the clueless media.
Even alarmist climate scientist and BDS-sufferer James Annan is scoffing at the paper’s claims, suggesting that it should say “UKESM1 does a great job at everything other than its primary function”.
Are these Met Office climate muddlers really so self-deluding that they think it shows good agreement? Yet again, Feynman deserves the last words:


Well done Paul. The CMIP6 models seem to be being lined up as a foundation stone for the next generation of climate bullshit. How surprising to find they have deception in the ‘key points’.
If you count from before the IPCC was formed it’s over 40 years, as I’m sure you know. To finally bust open this explicit lack of progress in something so fundamental, in the direction of higher sensitivity, is quite something. What will the IPCC lower bound be now?
LikeLiked by 1 person
“Overall the model performs well, with a stable pre-industrial state…”
Which could be modelled with a pencil and paper as dT = 0.
Can I have a few quid for my climate model now? It has a stable pre-industrial state, so it’s pretty good.
LikeLiked by 1 person
“… an analysis of the full suite of CMIP5 historical simulations … reveals that 111 out of 114 realizations show a GMST trend over 1998–2012 that is higher than the entire HadCRUT4 trend ensemble”
97%!!!!!!
YCMIU
LikeLiked by 2 people
Richard,
Climate scientist Joelle Gergis reckons that the new climate sensitivity range in AR6 will be 2.8C to 5.8C, which is absurd. No science, just politics.
https://www.themonthly.com.au/issue/2019/august/1566136800/jo-lle-gergis/terrible-truth-climate-change
LikeLiked by 2 people
Gergis of course was the lead author of a bogus hockey stick paper that was withdrawn.
https://wattsupwiththat.com/2012/10/18/gergis-et-al-hockey-stick-paper-withdrawn-finally/
But yes, of course the agenda is to crank up the climate sensitivity numbers for AR6 and to push the “worse than we thought” narrative. Which they’ve done quite successfully, as we can see here – the climate models are worse than we thought!
LikeLiked by 2 people
Thanks Paul. It is really quite unbelievable that “scientists” would do this kind of thing. They may have tried to make their sub grid models more accurate when compared to what little data is available. But it sounds to me like they undid some of the skill through cancellation of errors they had put into the older model.
LikeLiked by 1 person
Paul, you quote perhaps the one thing Feynman got wrongest…
“…and you are the easiest person to fool.”
….because he didn’t live long enough to witness the descent of man into climatism.
These ‘scientists’ don’t fool themselves for a second. They fool the Greta Thunbergs and the Ed Begley Jrs of the world. Those are the exceptions that prove the rule: the climate movement is led by crypto-insouciant pseudo-concerned frauds who are in it for sixteen point three TRILLION reasons (none of them science), assuming Bernie Sanders gets in, or at worst a COUPLE of trillion when some other Democrat wins.
That’s twelve zeroes. Twelve zeroes buys a lot of oversensitivity to CO2.
All models are wrong, some are useful, and some are useful because they’re wrong.
And I don’t mean scientifically useful.
LikeLiked by 2 people
@Paul-
No Timeline on the 2nd graph & the UKESM1 line dips below the HadCRUT4 line before rising at the end?
am I reading the “model outputs/results” correct?
like this new observation by the AGU team –
“for example, dust is produced on the land and blown up into the atmosphere where it affects the amount of sunlight falling on the Earth. Dust can also be dissolved in the ocean, where it affects marine life”
as an related o/t – anybody watched the new Delhi smog/toxic air story being pushed by the usual MSM outlets?
LikeLike
Jaime: Thanks for that. Joelle Gergis vs Nic Lewis it is then.
Brad: Agreed, this has gone beyond self-fooling to keeping useful idiots in a constant state of unreflective panic.
LikeLiked by 1 person
See also Jaime’s new post which mentions another climate scientist, Gavin Foster, raising awkward questions for the Met Office, and goes into more details about the excessive climate sensitivity and aerosol forcing used in the new models.
LikeLiked by 1 person
It is no wonder this new generation of climate models don’t fit the data. They are all so-called “Earth System Models” which also pretend to simulate a whole bunch of fuzzy things such as :
Biology, Human nature, Carbon Cycle, Dust emissions, vegetation, Farming etc. none of which are defined by differential equations, but instead are simply guesswork. (see Table 1).
Meanwhile simple models like those of Nic Lewis give far more sensible results.
LikeLiked by 3 people
The figure you pointed us (which is so much ignored by the Gretaista) has an interesting copyright.
“You may freely download and copy the material contained on this website for your personal, non-commercial use, without any right to resell, redistribute, compile or create derivative works therefrom, subject to more specific restrictions that may apply to specific materials.”
So basically they try to limit your ability to do critics in context. You redistributed the file, though I guess this is ‘fair use’, it is not what they explicitly allow.
LikeLike
Even Gavin seems to be uneasy about these new models.
“Why might these numbers be wrong? Well, the independent constraints from the historical changes since the 19th C, or from paleo-climate or from emergent constraints in the CMIP5 models collectively suggest lower numbers (classically 2 to 4.5ºC) and new assessments of these constraints are likely to confirm it.”
“What is clear is that (for the first time) the discord between the GCMs and the external constraints is going to cause a headache for the upcoming IPCC report.”
LikeLiked by 2 people
@Richard,
“Climate scientist Joelle Gergis reckons that the new climate sensitivity range in AR6 will be 2.8C to 5.8C, which is absurd.”
No, that’s not absurd when you compare to the actual status of research on climate sensivity. Look on https://www.carbonbrief.org/explainer-how-scientists-estimate-climate-sensitivity
and the linked excel-table:
https://docs.google.com/spreadsheets/d/1Bw2XU3FCw9a__Z5Y9YGfCWU-ohzuhFJ8_gcGyIsTECE/edit?usp=sharing
Then you see: the value for ECS is totally “open” and is moving between 0 and 10, during the last 3 years between 0.39 and 8.1.
So if or when the IPCC would show the status of climate research and if or when the models would use these values it would be clear that nothing is known on climate sensivity and that all results could be computed by the models: from “nothing will be happen by rising CO2” to “extremely catastrophic climate change in the future”.
Whatever the models are doing: garbage in – garbage out, because the basis is totally unusable, the ECS.
This is the acutal status of research on climate change!
The scientists can’t say whether CO2 has an influence on climate nor when there is an influence, whether he is small, medium or big.
Absurd is all what the IPCC and the climate activists say, that we will have a climate change by CO2 and that this will be a catastrophic.
LikeLike
It is as if we have regressed to an age of miracles. Instead of selling relics the prevailing church is selling magical climate models. At least the old relic sham made people feel redeemed. All the faux climate models do is sell magic about a doom that is not happening.
LikeLike
New models for old.
But which conceals a Genie?
LikeLike
Also Gavin (thanks Paul):
But here surely we have the many ‘independent confirmations’ of Mann’s original hockey stick to guide us. Here’s my prediction. Given the vast degrees of freedom available to those creating highly complex GCMs there won’t just be one answer to explain the high values produced by each of them. But the sizeable increases since last time will be far from a coincidence. The ’emergent pattern’ will be down to something else entirely.
LikeLiked by 1 person
Judith Curry covered this the other day in ‘Escape from model land’…
The title and motivation for this post comes from a new paper by Erica Thompson and Lenny Smith, Escape from Model-Land. Excerpts from the paper:
“Model-land is a hypothetical world (Figure 1) in which mathematical simulations are evaluated against other mathematical simulations, mathematical models against other (or the same) mathematical model, everything is well-posed and models (and their imperfections) are known perfectly.”
. . ‘
“It is comfortable for researchers to remain in model-land as far as possible, since within model-land everything is well-defined, our statistical methods are all valid, and we can prove and utilise theorems. Exploring the furthest reaches of model-land in fact is a very productive career strategy, since it is limited only by the available computational resource.”
https://judithcurry.com/2019/10/29/escape-from-model-land/
Figure 1 with the black hole in the middle is amusing.
LikeLiked by 2 people
Nice work Paul. Just a few points.
1. The figure that you show is the top portion Figure 11.25 of IPCC 5AR. It has no HadCRUT4 uncertainty but if you click on the URL that you provide it shows a different IPCC version of the same figure, this time with the HadCRUT4 uncertainty.
2. There are other relevant quotes that can be lifted from IPCC 5AR. Here’s the four that I’ve lifted, one of which you use.
(i) “… the rate of warming over the past 15 years (1998–2012; 0.05 [–0.05 to 0.15] °C per decade) … is smaller than the rate calculated since 1951 (1951–2012; 0.12 [0.08 to 0.14] °C per decade).” [WG I SPM, page 5, section B.1, bullet point 3, and in full Synthesis Report on page SYR-6]
(ii) “… an analysis of the full suite of CMIP5 historical simulations (…) reveals that 111 out of 114 realisations show a GMST trend over 1998–2012 that is higher than the entire HadCRUT4 trend ensemble ….” [WGI contribution, chapter 9, text box 9.2, page 769, and in full Synthesis Report on page SYR-8]
(iii) “There may also be a contribution from forcing inadequacies and, in some models, an overestimate of the response to increasing greenhouse gas and other anthropogenic forcing (dominated by the effects of aerosols).” [WG I SPM, section D.1, page 15, bullet point 2, and in full Synthesis Report on page SYR-8]
(iv) “This difference between simulated [i.e. model output] and observed trends could be caused by some combination of (a) internal climate variability, (b) missing or incorrect radiative forcing and (c) model response error”. [WGI contribution, chapter 9, text box 9.2, page 769]
cheers
John McLean
LikeLike
SORRY – My mistake. Figure 11.25 is the same in both cases. I confused it with 11.9(a) which is 42 models trying to predict future temperatures from IPCC scenario RCP 4.5.
John McL
LikeLike
CMIP6 original version apparently included solar influences which, when included in model runs, showed there was no need to include CO2 to obtain the current temperature plot. Apparently modellers called for a version of CMIP6 without the solar influences in order to be able to continue to ‘model’ CO2 effects.
LikeLike
Look, simulation and projection can’t be easy when you don’t know the parameters and have to wing it!
“The actual equations used in the GCM computer codes are only approximations of the physical processes that occur in the climate system. While some of these approximations are highly accurate, others are unavoidably crude. This is because the real processes they represent are either poorly understood or too complex to include in the model given the constraints of the computer system. Of the processes that are most important for climate change, parameterizations related to clouds and precipitation remain the most challenging, and are the greatest source of disagreement among different GCMs.” Judith Curry, Climate Models for Lawyers. 12/11/16.
LikeLiked by 2 people
Like DFHUNTER, I noted the dip below the HADCRUT temperature line of the model. This is hardly “good agreement” particularly since you could map a high order polynomial to the HADCRUT data and get excellent agreement.
I’ve always thought it dishonest that the variance between models is displayed as it it were the uncertainty of the model output. They are two very different things.
LikeLike
“The IPCC AR5 Report included this diagram, showing that climate models exaggerate recent warming:”
1. super old chart.
2. the method they used wasnt the best.
eg. they compared apples and oranges
3. the skill beats a niave forecast.
lesson in the principle of charity. you have to present your opponents BEST argument, even if he hasnt.
so you need to compare model outputs of SAT and SST with observations of both of those. this mistake was corrected a while back.
if you want to win, your job is to prsent the best form of your opponents position, not one they have already corrected.
when you publish science you will be hit with this. oh wait, you blog.
LikeLiked by 1 person
Clearly an illiterate arts graduate knows better.
LikeLike
SM,
We are in the age of rewrites if historical data. That just happen to save the crap models. Please stop your sanctmonious pose. Australia, South America, and elsewhere. Adjusted by the same people who wrote the models.
That redpill podcast version of Steve Mosher was Borgged a long time ago. But some vestige must remain, albeit expressed in a delphic bullying sort of way.
It is the side you chose to align with that gives us grid instability, massive blackouts, ridiculous energy regulations, censorship, XR, academic corruption, Greta, and climate imperialism.
Yet you claim to be following the science.
But “CO2 is a ghg”
That excuse to dodge the issue is a dead parrot.
LikeLike
Ross McKitrick has updated the graph originally supplied by the IPCC AR5 above. After the warming of El Nino in 2016, the models (CMIP5) are basically back where they were as regards the mismatch between observations and projections. Comparing the CMIP6 models to observations will be fun!
Click to access model_obs_comp_nov_2019.pdf
LikeLike
From my understanding of the current beliefs, ECS is irrelevent in anything but the longest terms. In AR5, the detailed projections of temperatures in 2100 under various RCP scenarios are contained in WG3, Chapter 6, table 6-3. In the small print, note 7 mentions about using the TCR of 1.2-2.6C (median 1.8C). This compares do not use the ECS of 1.5-4.5C (median 3.0C).
Compare this to the key figure of Hansen et al 1988.
There are three scenarios covered. I will demonstrate my complete incompetence as a climate scientist by stating the assumptions behind the scenarios. Scenario A assumed all GHG emissions would continue increasing exponentially at 1.5% per annum. Scenario B assumed emissions would be quickly stabilised at the then current levels. Scenario C assumed global emissions would be brought to near zero by year 2000.
From my reading of the chart, Scenario C implies it takes around 5-7 years to achieve ECS. However, TAR Chap 9 p.33 defines TAR as follows
1%/yr increase in CO2 levels implies a doubling of CO2 – hence achievement of TCR – in about 70 years. Although the rate of rise in CO2 levels has been accelerating, with current CO2 levels at about 410ppm, the 3ppm pa rise is still much less than 1%, so TAR will take much longer to achieve than these 2001 models.
An example. The Stern Review of 2006 claimed that the rise in all GHGs were the equivalent to CO2 being at 430ppm, when CO2 levels were about 385ppm. If ECS = 3.0 & pre-industrial CO2 levels were 280ppm, the implied eventual warming would be about 1.8C. Actual warming was less than half this level and not even than half of that could be attributed to GHGs (REM in AR5 > 50% of warming since 1950 can be attributed to GHGs rises & net warming from 1850-1950).
By making the achievement of full ECS well over century – indeed even full TCR for over a century – climate modellers claim avoid a confrontation between their collective beliefs and empirical reality for decades to come.
LikeLike
In the previous comment @ 21 Nov 19 at 12:52 am I stated with reference to Hansen et al 1988
Why I am incompetent in climate science is demonstrated by a post by premier Climate Scientist Dr Gavin Schmidt on the 30th anniversary of the testimony to Congress of his former boss James Hansen at Real Climate
http://www.realclimate.org/index.php/archives/2018/06/30-years-after-hansens-testimony/
Gavin does not mention the assumptions behind scenarios A, B & C at all. This is useful, as projections that have been essentially falsified by the data, can be made out to have performed reasonably well.
The actual surface temperature data (which is likely to have a warming bias) sits somewhere between scenarios B (emissions constant at late 1980s levels) and C (global emissions reduced to near zero by 2000). Actual emissions have increased in line with Scenario A of 1.5% a year. CO2 by 1.9% a year 1987-2018 & CH4 by 1.2% a year 1990-2012.
The slight of hand that Gavin commits as a “Real Cimate Scientist” is to look at the model inputs. The climate model inputs are the rise in the atmospheric levels of the GHGs. This is his graphic.
The omitted step, from my perspective a (slightly) manic beancounter, is the quantity of emissions of trace gases to raise atmospheric levels by one unit. By my quick estimate from the above, actual quantities of emission compared to Hansen et al 1988 are 25-30% more for CO2 and 15 times more for CH4. So even if a unit rise in CH4 level has 25 times the warming of a similar unit rise in CO2 levels, a unit of CH4 emissions is less than twice the impact of a unit of CO2 emissions. If all 7.6 billion humans go vegan it would not reduce the impact of GHGs by 15% but by 1%.
LikeLike
Thanks for this Kevin. To replay the Twitter interaction I had on 9th, mentioned elsewhere:
I knew there was bound to be the kind of sleight of hand you’ve detailed here in the graph provided but I also felt there was no way trying to prove it wouldn’t become a distraction, so this seemed best as the appropriate put-down
followed, only then, by hitting the entirely fallacious use of ‘evidence’
The dishonesty of climate science in this area is in effect protected by the vast complexity of the models and their inputs. In blog format, it’s well worth doing what you’ve had a go at. But it’s also worth avoiding in much hand-to-hand combat because then the simplicity of energy balance models, as used by Lewis and Curry, can be seen to win out.
LikeLike
“Gergis of course was the lead author of a bogus hockey stick paper that was withdrawn.”
not many remember that at the same time gergis was withdrawn, watts 2012 was withdrawn.
took gergis 4 years to publish.
watts is still trying to fix the mess he posted in haste.
LikeLike
Here is another paper, about another CMIP6 model.
https://agupubs.onlinelibrary.wiley.com/doi/10.1029/2018MS001603
Again it shows that the model fails to match recent temperatures, but at least in this case the authors are honest about it.
“While E3SMv1 captures the bulk of the observed warming between the 1850s and 2010s, the trajectory of the warming is at times inconsistent with observations. The ensemble overlaps with observations until the 1950s, but in the subsequent decades, E3SMv1 departs from observations, first remaining too cold for several decades before warming up too rapidly starting around year 2000.”
LikeLike
“. . . . the trajectory of the warming is at times inconsistent with observations.”
I’ll say so! You only have to look at that graph to see that the model is totally unrealistic. Just because it matches up fairly well pre 1958 does not mean it is doing a good job.
As with the two UK models, the reason it diverges so drastically from reality is that it has an almost fantastically high climate sensitivity combined with very unrealistic aerosol forcing.
“Using a two‐layer energy balance model, we attribute this divergence to the model’s strong aerosol‐related effective radiative forcing (ERFari+aci = −1.65 W/m2) and high equilibrium climate sensitivity (ECS = 5.3 K).”
Why are they even bothering with these fantasy models? It can only be because they predict catastrophic warming over the 21st century. It doesn’t matter that they’re wrong – they’re scary.
LikeLike
… and here’s another one, again showing that most CMIP6 models show more warming than the observations, see fig 1a.
Click to access esd-2019-86.pdf
LikeLike
Yes Paul. However, this paper seems to obtain a TCR based on a short period (I believe 1970 – 2013) the is much higher than Lewis and Curry’s which is based on much more careful analysis. Their methods seem to me to be open to question. You would need a huge number of model runs it seems to me to reach a valid conclusion.
LikeLike
Cliscep was ahead of the game. Why don’t more people listen to us!?
https://twitter.com/RyanMaue/status/1225485392419414016
LikeLike
And another new CMIP6 paper is out, again showing too much warming in recent times (Fig 7).
Kudos to James Annan who is not impressed.
The authors mention the overshoot in the discussion, but claim that it is not unexpected:
LikeLike