Much has been written about the newly released IPCC Special report on global warming of 1.5C, in the media and on blogs ranging from sceptical, to not so sceptical, to climate consensual, to downright alarmist. Much more will be written I am sure. This is just a short(ish) post on my initial impressions upon reading the Summary for Policy Makers and some of Chapter 1.
After the Introduction, the authors get straight down to business with this statement:
Jones et al. (2016) show (Figure10) human-induced warming trends over the period 1905 –2005 to be indistinguishable from the corresponding total observed warming trend accounting for natural variability using spatio-temporal detection patterns from 12 out of 15 CMIP5 models and from the multi-model average. Figures from Ribes and Terray (2013), show the anthropogenic contribution to the observed linear warming trend 1880-2012 in the HadCRUT4 dataset (0.83°C in Table 1.1) to be 0.86°C.
The pattern of warming and residual differences between models and observations indicate a role for circulation changes as a contributor to early 20th cenury warming (Figure 10.2), and the contribution of internal variability to the early 20th century warming has been analysed in several publications since the AR4. Crook and Forster (2011) find that the observed 1918–1940 warming was significantly greater than that simulated by most of the CMIP3 models. A distinguishing feature of the early 20th century warming is its pattern (Brönnimann, 2009) which shows the most pronounced warming in the Arctic during the cold season, followed by North America during the warm season, the North Atlantic Ocean and the tropics.
Some studies have suggested that the warming is a response to the AMO (Schlesinger and Ramankutty, 1994; Polyakov et al., 2005; Knight et al., 2006; Tung and Zhou, 2013), or a large but random expression of internal variability (Bengtsson et al., 2006; Wood and Overland, 2010)
Nonetheless, these studies do not challenge the AR4 assessment that external forcing very likely made a contribution to the warming over this period. In conclusion, the early 20th century warming is very unlikely to be due to internal variability alone. It remains difficult to quantify the contribution to this warming from internal variability, natural forcing and anthropogenic forcing, due to forcing and response uncertainties and incomplete observational coverage.
In essence, what the IPCC said was that they could not attribute early 20th century warming (approx. 0.5-0.6C) to internal variability alone, that it was likely a result of some external forcing and some of that external forcing was likely anthropogenic, though they could not specify the exact contribution. Why, I wonder, did SR15 not mention this paper, also published after AR5, which attributes the early 20th century warming to a combination of internal variability/circulation changes (about half) and natural and anthropogenic external forcing.
These anomalous events occurred during a period of strong global‐scale warming, which can be attributed to a combination of external forcing (particularly, greenhouse gas increases, combined with a hiatus in volcanic events) and internal decadal variability. The exact contribution of each factor to large‐scale warming remains uncertain, largely due to uncertainty in the role of aerosols in the cooling or stabilization of climate following the middle of the 20th century.
This basically echoes the earlier conclusions of AR5 WG1. The contribution from early 20th century warming to total post industrial warming up to 2010 is not insignificant, being roughly equal to the rapid warming which occurred 1976-1998, each period contributing about 0.6C. Mid-20th century cooling (which climate science likes to attribute mostly to anthropogenic aerosols masking ongoing warming) was about 0.2C, which gives the 1.0C net post industrial rise in global mean temperature. So obviously, if say, anthropogenic warming only contributed about a quarter to the early 20th century warming (which is not an unreasonable guesstimate given the available scientific literature on this subject), natural forcings then contributed approximately 0.6-0.15=0.45C to the total post industrial warming, i.e. nearly half. SR15 reduces this to zero in favour of anthropogenic warming!
So the very first sentence of the SR15 Summary for Policy Makers, after the Introduction, consists of a statement which is not well supported by the totality of the available scientific literature and which is at odds with the IPCC’s own findings in the AR5 Working Group 1 Report of just 5 years ago! Not a good start.

The IPCC was not suffiently alarmist.
The obsessed alarmists are correcting that, apparently.
LikeLiked by 1 person
Here’s the link to the SR15 report
http://www.ipcc.ch/report/sr15/
LikeLike
Is it me, am I just jaded? The screaming and the dire warnings are there. The BBC exhibits paroxysms of Harribin and other noxious parodies, but somehow this IPCC extravaganza isn’t. Somehow my shoulders are shrugging and the event is passing me by. Could it be that I am no longer associated with UEA? Perhaps, but I just don’t think the whole alarmist boondoggle is relevant. They just might be right and the world is tipping into a handbasket, but their solutions are so unreasonable that there is no possible way they could be implemented. Could it be possible that scepticism has indeed won, but with a wimper?
LikeLiked by 1 person
So, as you point out, the IPCC has made the unsupported statement that all warming is anthropogenic in the first sentence.
But I think it’s worse than that. If you move on to the next paragraph, it says
“Estimated anthropogenic global warming is currently increasing at 0.2°C (likely between 0.1°C and 0.3°C) per decade due to past and ongoing emissions (high confidence).”
So anthropogenic warming is, according to this, entirely due to emissions. Previously, the IPCC has acknowledged that other anthropogenic factors, such as changes in land use, have contributed significantly, but this now seems to have been abandoned.
[For comparison, IPCC AR5 said:
“It is extremely likely that more than half of the observed increase in global average surface temperature from 1951 to 2010 was caused by the anthropogenic increase in greenhouse gas concentrations and other anthropogenic forcings
together.” ]
LikeLiked by 1 person
Paul,
What troubles me as much as anything is the cavalier manner in which the IPCC seems to be using its standardised language for expressing uncertainty. For example, they are now stating with ‘high confidence’ something that flies in the face of something they had previously thought ‘extremely likely’. So the next time they say that something is ‘extremely likely’ are we to understand that they really meant to say ‘as likely as not’, i.e. we really haven’t got a clue? As with weather forecasters, I think they relay a lot on people not monitoring their track record.
LikeLiked by 1 person
‘Relay a lot’?
Perhaps I meant to say ‘Rely a lot’. At least I am monitoring my mistakes!
LikeLike
The future warming projections in AR5 similarly assumed that all warming was human-caused. In fact SR1.5 follows AR5 in assuming that 100% of the warming is due to the increase in CO2 levels.
The justification for 100% CO2 is that the impact of other GHGs are netted-off by negative forcings like aerosols. Only it does not quite work out.
See Figure SPM-5 – Radiative forcing by emissions and drivers – on page 14 of IPCC AR5 WG1 SPM
There is a real problem with this assumption if one considers the error bars. Net forcing is 2.29 [1.13 to 3.33], whereas CO2 alone is 1.68 [1.33 to 2.03]
So CO2 was only 73% of calculated forcing increase.
In 2010 CO2 levels were 390 ppm, against 430 ppm for the CO2-eq of all GHG, up from about 280 ppm.
(390-280) is 73% of (430-280).
When looking at the total impact of GHGs AR5 WG3 SPM states in the last sentence on page 8
“For comparison, the CO2-eq concentration in 2011 is estimated to be 430 ppm (uncertainty range 340 to 520 ppm)”
If ECS = 3.0 CO2 alone is 1.4C. But GHG combined is 1.86C (range 0.84 – 2.68)
So the data gives no justification what so ever for considering CO2 alone.
LikeLike
I should justify my claim that AR5 alone considered the impact of CO2 in its emissions forecasts.
You may remember the headline forecast that it only 1000 GtCO2 could be emitted until 2C of warming was breached, compared to 1900 GtCO2 from 1870-2011
If ECS = 3, then from a start point of 280 ppm 2C of warming would be roughly reached from CO2 getting to 450 ppm. In 2011 CO2 levels averaged 392 ppm, a rise of 112 on pre-industrial levels.
Historically it took 16.96 (1900/112) GtCO2 to raise CO2 by 1 ppm.
In future it will take 17.24 (1000/58) GtCO2 to raise CO2 by 1 ppm.
Allowing for the roundings it is the same.
Now I have found evidence that the 2006 Stern Review and 2007 AR4 considered the impacts of other GHGs.
Problem is that doing so in AR5 would have blown the budget. In precise terms if ECS = 3.00, 2C comes at 444.5 ppm and 1.5C at 396 ppm. Mauna Loa CO2 levels in September 2018 were 405.51.
https://manicbeancounter.com/2018/10/03/why-cant-i-reconcile-the-emissions-to-achieve-1-5c-or-2c-of-warming/
A puzzle here. From 2012 onwards 2C of warming would be reached by CO2 levels rising by about 52.5 (444.5-392) ppm, 13 times the CO2 rise to reach 1.5C. So why last year was the UNEP emissions GAP Report 2017 and the SR1.5 of Monday projecting that it would take less than twice the emissions to reach 2C as opposed to 1.5C?
LikeLike
I posted on some notes on SR1.5 yesterday.
https://manicbeancounter.com/2018/10/09/ipcc-sr1-5-initial-notes-on-calculations/
ECS is now 2.7, compared to 3.0 in AR5 and AR4.
Considering CO2 alone, if ECS = 3.0, 1.5C of warming built in at 396 ppm, if ECS = 2.7, 1.5C comes in at 412 ppm.
Transient Climate response (TCR) is estimated at 1.6°C. On that basis a rise in CO2 levels from 280 to 400.83 ppm (level in 2015) would produce 0.83°C. Make TCR = 1.7°C and that increases to 0.88°C.
Average temperature rise was 0.87°C
From my calculations and SR1.5 statements
– 100% of rise in temperatures is due to rises in CO2 levels.
– ECS is set at the maximum level not to bust the 1.5C of warming.
– In over a century of rising CO2 levels all of the warming is the short-term transient response. There is no allowance for movement to long-term equilibrium.
But if ECS = 2.7, 1.5C of warming will be built in when CO2 levels hit 412 ppm (+ 6.5 on Sept-18) and 2C at 468 ppm (+62.5 on Sept-18). So why does it take only twice the emissions to reach 2C as opposed 1.5C?
LikeLike
Jaime:
Some historical facts:
The Roman Warming Period (c.250 BC-c.450 AD) ended because of two large volcanic eruptions in 450 AD: the VEI6+ eruption of Llopango, and the very large Plinian eruption of Pelee (VEI not estimated), which cooled the Earth because of their dimming Sulfur Dioxide aerosol emissions .
They were followed by additional large eruptions which kept the earth cool for hundreds of years, but the eruptions eventually abated, their dimming SO2 aerosols settled out of the atmosphere, cleansing the air, and the Earth naturally warmed up, resulting in the Medieval Warming Period (c. 950-c.1250).
The MWP ended with the VEI7 eruption of Mount Rinjani in 1257, the VEI6 eruption of Quilotoa in 1280, and a string of large VEI5 and VEI6 eruptions thereafter that maintained the Little Ice Age cooling,. The last large eruption of the LIA was the VEI7 eruption of Mount Tambora, in 1815.
Thereafter, as their dimming SO2 aerosols settled out of the atmosphere, Earth, again, began to naturally warm up (at the rate of .05 deg C./decade, 1900-1975, for example).
The IPCC completely ignored historical precedent, and attributed all of the warming since 1850 to man-made actions!
However, all of the anomalous warming since 1975 HAS been man-made, due to the reduction in the amount of dimming anthropogenic SO2 aerosol emissions because of global Clean Air efforts.
Thus, essentially all of the climate disasters that have occurred since then have been CAUSED by the environmental movement!
LikeLiked by 1 person
The basic questio off the report is of course: how Is the orange line calculated, wat is the used emission scenario, what is the forcing mix, what is climate sensitivity?

LikeLike
If I consider the hadcrut trend from Clive Best (see below), I notice a modest warming of 0.125 degrees per decade, which means that the 1.5 degree threshold will only be reached in 2060, if the trend persists, and the two degrees treshold in 2100. Which means that the Paris accord will be met in 2100 without any measures.

LikeLike
Thanks for the comments here. My intention is to do another post on SR15 soon.
Alan: the IPCC are now basically a self-declared political pressure group. They are going to find it much harder to promote their work as ‘science’ in the light of their obvious bias.
Paul: good point. SR15 appears to mark a departure from the carefully phrased statements of previous science-based reports, in favour of promoting a course of action.
Manic: the IPCC chart from AR5 SPM WG1 shows anthropogenic (plus one natural – solar) radiative forcings relative to 1750. It only goes back as far as 1950, where it shows the total anthropogenic radiative forcing was about 0.5W/m2. No estimate is provided for volcanic aerosol forcing. Also, obviously, no account is taken of mutli-decadal variability and the risibly small estimated impact of solar variability only accounts for observed changes in TSI, not for other, non-radiative climate impacts associated with solar variability. Thus the chart is not a good argument for attribution of climate change, much less so for climate change prior to 1950.
Burl: yes, volcanic aerosols and their interactions in the atmosphere have had a profound effect upon past climate change. There is no reason to suspect that they will not continue to do so, particularly as volcanic activity appears to be influenced by solar activity. Note that there were relatively few large tropical volcanic eruptions in the first millennium AD compared to the second and, apart from the modern period, solar activity was generally higher in the first millennium than in the second. Note also that the climate effects of volcanic SO2, injected high up in the stratosphere, is distinct from the climate effect of anthropogenic aerosols (SO2 included) emitted into the lower troposphere.
Hans: observations indeed do not match the climate projections of SR15 for when the 1.5C threshold will be breached, even assuming that the current warming trend remains unchanged. The IPCC projects that warming will accelerate in the coming decades under the influence of increased emissions. It takes no account of the fact that one or more large volcanic eruptions may interrupt this warming, that multidecadal variability may exert a significant cooling influence i the years to come and that reduced sunspot activity, possibly as serious as a Maunder type grand minimum, may impact climate considerably over the next several decades.
LikeLike
Perhaps Ward certainly knew of this claptrap before publication. Perhaps he was seeking, as a professional extremist/alarmist, to position this latest example of IPCC word parsing and deceptive story telling as a moderate credible report.
LikeLike
… Sorry about two posts so quickly.
So 2.0c, the great line in the hype, was the vaunted world saving “achievement” of the Paris confab.
Now 1.5c has taken its place with nary a worldwide climate confab.
It is like the professional alarmist class can no longer even be bothered with meetings, conferences, or agreements. They just expect the trained dogs of the world to respond to their increasingly incomprehensible fear and doom, as if trained to hear dog whistles.
Only the alarmist whistles do not transmit reason, logic, credibility, accurate data; only fear.
And their dog whistle commands results in the world fetching alarmists more and more money and power. While the climate continues to ignore them.
LikeLike
Jaime,
If I interpret you correctly the data backing the estimates relative to 1750 are for the radiative forcing impacts measured (or estimated) from 1950. That would tie in with the statistical claim that “at least half the warming since 1950 is very likely …….”.
If this is correct it augments an argument that I have been trying to articulate. An assumption (and there are others) behind estimates of the quantity of emissions to reach 1.5C or 2C of warming since pre-industrial times is that 100% of warming in that period has been human caused. From my calculations, even if 10% of the 0.87C of warming in the report is due to other factors it will materially affect that result. The reasons for not settling on the 100% includes multi-decadal fluctuations, or even longer cycles that the Bronze Age, Roman and Medieval warm period. It could include short term fluctuations such as the El Nino / La Nina cycles not being worked through in the data period.
I think this is an extreme example of what in philosophy is known as the underdetermination thesis
Or put more simply
With respect to problem of forecasting the quantity of emissions to get to 2C of warming there are a whole range of AGW assumptions that need to be made, along with the determining how much is due to “other” factors. Yet there is insufficient evidence to determine which mix of AGW and “other” there is; nor the value of ECS; nor the pathway to each full ECS; nor the value of TCR; nor the impact of CO2 on its own; nor the combined impact of GHGs; nor the impact of negative anthropogenic forcings; etc. Models are needed to sort out an coherent result, as many of the estimated measurements are contingent on the other estimates. As such there is no ability to say if the results are anywhere close to that achieved by perfect information and much more complete theory.
All what is possible to say about the estimated emissions behind 2C of warming is that they are based on a combination of empirical estimates that are as equally valid as a large combination of other (maybe quite similar) estimates that can produce materially different the results.
There is an analogy here with the criminal law. In principle, it is up to the prosecution for prove specific charges beyond reasonable doubt. A valid defense is that the available evidence could equally be used to put in the dock any number of other people.
LikeLiked by 1 person
Jaime
A very effective critique … !
If you are preparing another post about SR15 I wonder if you might look at the way the end point of the comparison data of GMST since 1850 seems to have been calculated. See A1.1. and particularly footnote 5.
I’m not a statistician but the method describes strikes me as a very good way to ‘enhance’ the current temperature figure by extending a trend line from a short data set past a spike (Elnino), that has a cause which is unrelated to AGW, some 15 years into the future before calculating an average based on combined empirical with predicted data. Shoddy no? But you probably noticed this.
Incidentally, having watched similar IPCC events roll by since 2001, I am surprised how muted the BBC coverage had been this time, although all the old bad habits are still there of course. I suspect that David Shukman has quite a well developed sense of self preservation since his experience with the Oryx affair, and may realise that this is an IPCC scare report too far.
LikeLike
Why is the orange trendline steeper than the observed blue trend in this milennium? This has a huge effect on the time span to 1.5 degrees.(Blue line according to Clive Best trend clivebest.com/blog/?p=8628)

LikeLiked by 1 person
The history of this whole progression is important but little attention is paid to the pre-IPCC days.
“World Climate Programme – International Conference on the Assessment of the Role of Carbon Dioxide and of Other Greenhouse Gases in Climate Variations and Associated Impacts, VILLACH, AUSTRIA, 9-15 OCTOBER 1985”
https://library.wmo.int/index.php?lvl=notice_display&id=6321#.W8HF1vZRfs0
UEA’s Phil Jones and Tom Wigley were both participants, as was Martin Parry, now at the Grantham Centre at Imperial.
“As a result of the increasing concentrations of greenhouse gases, it is now believed that in the first half of the next century, a rise of global mean temperature could occur which is greater than any in man’s history. The role of greenhouse gases other than CO2 in changing the climate is already about as important as that of CO2.
If present trends continue, the combined concentrations of atmospheric CO2 and other greenhouse gases would be radiatively equivalent to a doubling of CO2 from pre-industrial levels possibly as early as the 2030’s. The most advanced experiments with general circulation models of the climatic system show increases of the global mean equilibrium surface temperature for a doubling of the atmospheric CO2 concentration, or equivalent, of between 1.5 and 4.5°C.”
The whole thing grew legs and has now morphed into the massive nexus that pertains today. In 1990, the IPCC had happened and was to produce issue that year. Prior to that there was a report from the Stockholm Environment Institute which built on the Villach and Bellagio WMO conferences:
“Targets and Indicators of Climatic Change” edited by F.R. Rijsberman and R.J. Swart
The Stockholm Environment Institute 1990
The executive summary for WG2 of that report was written by a couple of familiar IPCC names, Per Vellinga and a certain Peter Gleick, of Heartland documents fame.
They took hubris to a whole new level which has not dissipated to this day, with the belief that the climate can be controlled by government diktat.
“Principal Conclusions and Recommendations
Limit the impacts on human society and natural ecosystems;
• Limit the rate and magnitude of sea-level rise;
• Limit the rate and magnitude of temperature change;
• Stabilize the ambient concentrations of specific greenhouse gases;
• Stabilize and/or reduce emissions of greenhouse gases and enhance sinks to stabilize
the atmospheric concentrations of greenhouse gases; and
Take measures to reduce greenhouse gas emissions in an equitable manner among the different actors.
SEA-LEVEL RISE
A maximum rate of rise of between 20 and 50 mm per decade.
A maximum sea-level rise of between 0.2 and 0.5m above the 1990 global mean sea level.
Limiting sea-level rise to a maximum of 0.5m would prevent the complete destruction of island nations, but would entail large increases in the societal and ecological damage caused by storms.
The “new” target of 1.5 degrees C is not new at all but is a fudge between the 2 degree meme and the desired 1 degree from this group.
“MEAN GLOBAL TEMPERATURE
A maximum rate of change in temperature of 0.1 °C per decade. The rate of temperature change target refers to realized warming.
Two absolute temperature targets for committed warming were identified. These limits entail different levels of risk:
(i) A maximum temperature increase of 1.0 °C above pre-industrial global mean temperature.
(ii) A maximum temperature increase of 2.0 °C above pre-industrial global mean temperature.
These two absolute temperature targets have different implications. It is recognized
that temperature changes greater than the lower limit may be unavoidable due to greenhouse gases already emitted. The lower target is set on the basis of our understanding of the vulnerability of ecosystems to historical temperature changes.
Temperature increases beyond 1.0 °C may elicit rapid, unpredictable, and non-linear
responses that could lead to extensive ecosystem damage. [what happened to that?]
An absolute temperature limit of 2.0 °C can be viewed as an upper limit beyond which the risks of grave damage to ecosystems, and of non-linear responses, are expected to increase rapidly.”
A footnote says “Greenhouse gases differ in their heat-trapping capabilities. A CO2-equivalent
concentration of 400 ppm refers to a combined wanning effect from increases in all
greenhouse gases that is equal to increasing the concentration of CO2 alone to 400 ppm.”
“Varying combinations of concentrations of greenhouse gases — and consequently
varying combinations of emissions — are possible to meet the same temperature targets”
The IPCC First Assessment Report stated that: “Our judgement is that: global mean surface air temperature has increased by 0.3 to 0.6 oC over the last 100 years…; The size of this warming is broadly consistent with predictions of climate models, but it is also of the same magnitude as natural climate variability.
https://en.wikipedia.org/wiki/IPCC_First_Assessment_Report
Now of course, their claim is that CO2 is the Devil’s breath.
LikeLike
wanning = warming of course, transfer from pdf to notepad!
LikeLike
MANIC refers above to the Trillionth tonne meme, which is the property of Myles Allen from the Oxford Environmental Change Institute, https://wattsupwiththat.com/2018/10/11/bbc-the-worlds-top-climate-scientists-who-are-they-answer-activists/
He describes it in this Nature article from 2009, http://www.environmentportal.in/files/Warming%20caused%20by%20cumulative%20carbon%20emissions.pdf
“Hence policy targets based on limiting cumulative emissions of carbon dioxide are likely to be more robust to scientific uncertainty than emission-rate or concentration targets. Total anthropogenic emissions of one trillion tonnes of carbon (3.67 trillion tonnes of CO2), about half of which has already been emitted since industrialization began, results in a most likely peak carbon-dioxideinduced warming of 2 6C above pre-industrial temperatures, with a 5–95% confidence interval of 1.3–3.9 6C.” [Love the confidence interval]
He then gives the game away:
“Under conventional climate stabilization scenarios, greenhouse gas emissions are reduced until atmospheric composition approaches a stabilization level consistent with a desired equilibrium warming and are then adjusted to hold concentrations stable thereafter.
If climate system and carbon cycle properties were known, this would be straightforward: we could reliably map emissions to temperatures and vice versa.”
Of course “the science” has been “unequivocal” for the last 40 odd years and still they continue to spin speculation as fact.
LikeLike
6C should be read as °C
LikeLike
Thanks Hans.
LikeLike
A particularly egregious bit of fear mongering is the claim the IPCC makes about coral.
Now all of the coral is all going to die if the world’s air temperature increases less than 2oC.
This claim is so stupid it is not even wrong.
It seems that climate extremism requires a dumbing down. And the dumbness is directly proportion to the position of influence the afflicted extremist holds.
Whoever actuslly believes coral is that delicate and put their fantasy in writing must be a highly influential person.
LikeLiked by 1 person
Let’s also remember the IPCC ploy of substituting limits of atmospheric CO2 for GMT targets. Some years ago, IPCC asserted that the world could prevent 2C of additional warming by keeping atmospheric CO2 below 450 ppm (the “450 scenario”). With this new report they assert warming of 1.5C is prevented by capping atmospheric CO2 below 430 ppm. All of the spinning of emission targets takes off from there.
However, this flies in the face of previous IPPC projections which were put far enough in the future not to come due before current experts retired. The graph below shows the present crowd will find it hard to escape accountability for leading the world astray.
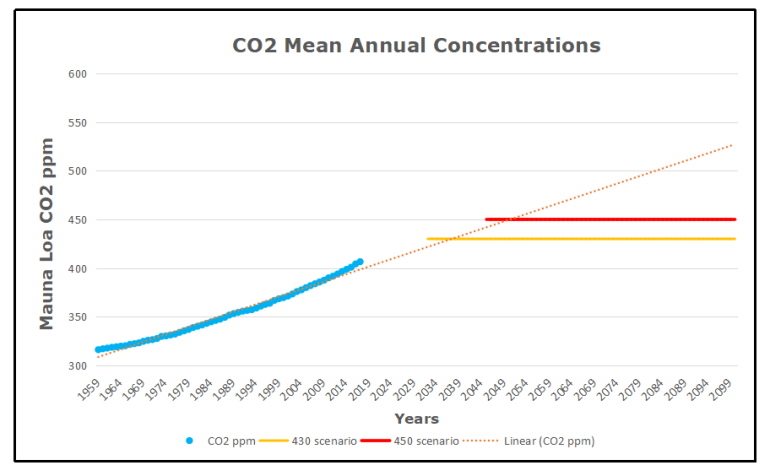
https://rclutz.wordpress.com/2018/10/04/un-stretches-co2-goals/
LikeLike
It seems the driver of this claim that all warming is anthropogenic, is Professor Myles Allen of the Oxford Environmental Change Institute: https://www.nature.com/articles/s41598-017-14828-5
He was Co-ordinating Lead Author for Chapter 1 of SR15: https://wattsupwiththat.com/2018/10/11/bbc-the-worlds-top-climate-scientists-who-are-they-answer-activists/
Not mentioned in that piece is the fact that in the 2012 La Jolla report, they quote funding from the Grantham Institute.
In the Halstein et al paper above, Allen is not named as lead author, but the tactic of changing lead authors improves the “consensus” of scientific opinion and was noted in the climategate e-mails.
From the Nature paper:
“Using HadCRUT4, the human-induced warming in May 2017, calculated relative to the period 1850–79, reached +1.01 °C with an uncertainty range of +0.87 to +1.22 °C (5–95% confidence interval) as shown in Fig. 1 (orange line). The corresponding natural externally-driven change is −0.01 ± 0.03 °C and hence very small in comparison to the human contribution (blue line in Fig. 1). Essentially all the observed warming since 1850–79 is anthropogenic. Using HadCRUT4-CW instead, the GWI for May 2017 is +1.08 °C with an uncertainty range of 0.92 to 1.32 °C”
They now have a Global Warming Index to Jan 2018 which claims 1.021C (such precision) relative to the period 1850-1879: http://www.globalwarmingindex.org/AWI/AWI_AR5_large.html
The pre-cursor WMO meetings prior to the IPCC claimed drastic effects of warming over 1 degree C. As we are already there, what are they. Judith Curry says that, using the BEST data, we are already at 1.5 C and yet there is nothing out of the ordinary, despite the doom claims, but they will keep this AGW ship afloat for many more years to come, as long as our politicians swallow the pill and keep giving them our money.
And then we have this:
https://www.politico.eu/article/bank-of-england-mark-carney-eco-warrior-climate-change-sustainable-finance-banks-investors/
LikeLike
‘Real Time Global Warming Index’, indeed. What a joke. Mickey Mouse science.
LikeLike