As I showed a few days ago, this summer 2018 turned out to be the fifth warmest summer on record in the long running Central England database, going all the way back to 1659. It was beaten hands down by 1826 in second place and the superlative summer of 1976 in first place. The main reason this summer failed to live up to warmist expectations was that August was a flop. June was very warm, July was blistering, but then in early August, the blocking Scandinavian high which had delivered the exceptionally hot, sunny weather broke up and things became a lot more unsettled, kicking off with some momentous thunderstorms.
But whaddya know? The Met office have announced that 2018 was the ‘hottest summer evah’ in England according to weather station data going back to 1910. Also, even though Wales, NI and Scotland failed to make it into the record books, the UK summer of 2018 was overall as warm as 1976, 2003 and 2006, i.e. we now have four equal ‘hottest summers evah’ in the UK. The Met Office tweeted this very curious map in support of their statement that England 2018 was warmer than 1976:
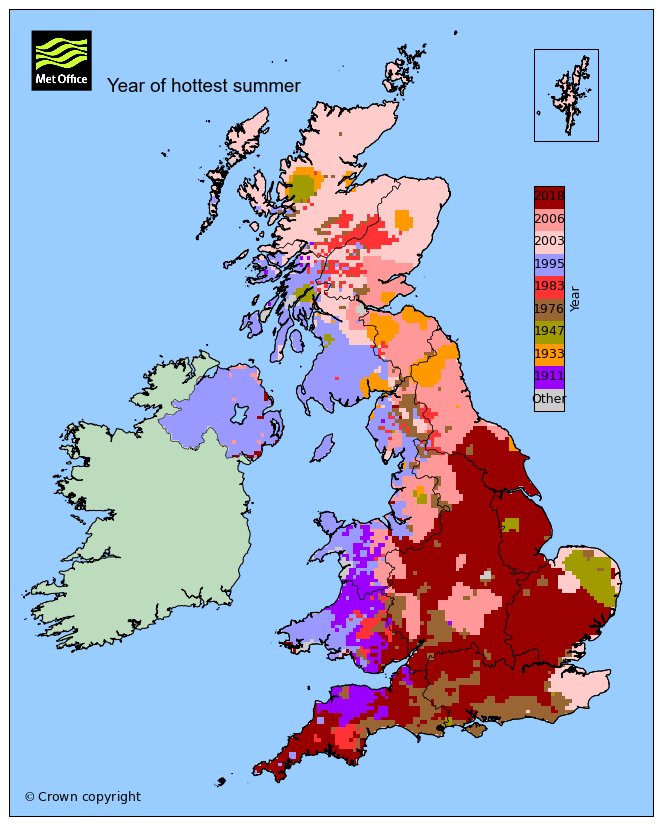
It basically shows which regions in the UK had a record warm June July August in what year. As you can see, the red (2018) occurs mainly in England. The brown (1976) is obliterated in England by the red, even in the area where you might expect brown to dominate (Central England), on account of Central England temperature being a full half a degree warmer in 1976 than in 2018. This mystified Clive Best too who tweeted:
Here is the map of Central England (which has about 30 weather stations contributing to the data, contrary to just three, as suggested by Ed Hawkins).
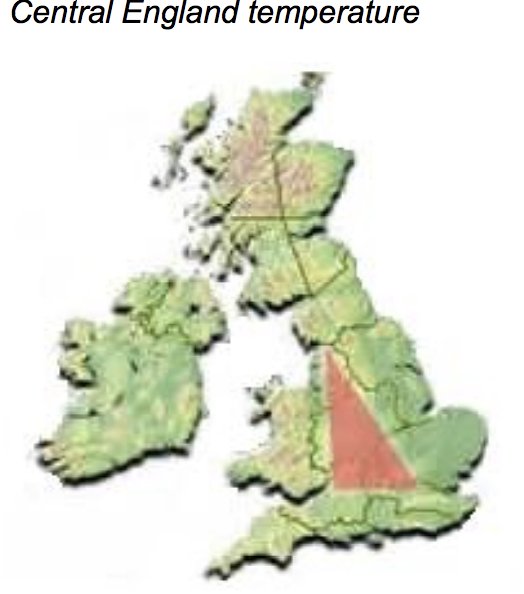
Most of this area is red or pink in the Met Office map, suggesting much of the region was warmer in 2018 and 2006. I don’t know how that works to be honest.
If we look at individual months in 1976 and 2018, what we find is that, in the England database going back to 1910, June was hotter in ’76 than in 2018 and July was hotter in 2018 than it was in 1976:
In actual fact, according to the data:
June 1976 – 16.4C; June 2018 – 15.8C
July 1976 – 17.7C; July 2018 – 18.8C
Aug 1976 – 16.8; Aug 2018 – 16.8C
Crunching these numbers, in England in 1976, the average mean daily temperature = 17.0C; in 2018, the figure is 17.1C. Meaning that summer 2018 in England was warmer than 1976 by 0.1C – the Met office have a new summer heat record!
In Central England, it’s a very different story. Summer 2018 comes a measly 5th place and 1976 first place; warmer than 2018 by half a degree Celsius. What is very curious is that August 1976 was 17.6C. In 2018, August was a full degree cooler at just 16.6C. This is a glaring mismatch between England data (where both Augusts rank equally warm) and Central England data. England and Central England are not worlds apart; indeed one incorporates the other. Was Eastern England, which is not covered by Central England, considerably hotter in 2018 than in 1976, enough to account for the difference between the two months perhaps? It would be interesting to look at actual station data. All I can say is that I live in Eastern England and August has been fairly cool and unsettled.
It is well known that the superlative summer heatwave of 1976 continued throughout most of August, with high pressure dominating, breaking up only in the last week. Contrast this with 2018, where we saw a blistering July followed by a decidedly disappointing, unsettled, fairly cool and at times very wet August. It doesn’t seem to add up that August in England ended up tying with 1976 in terms of average mean daily temperature. The only way to examine this discrepancy would be to look at all the individual station data, which is perhaps a task for a long cold winter’s night, snuggled up next to a warm fire with a bottle of red wine for company!

The Met office has about 400 manned and automatic stations across the UK. The link below shows a map of them. Click on the dots to see individual stations
https://www.metoffice.gov.uk/public/weather/climate-network/#?tab=climateNetwork
There are only 2 in Anglesey and only 4 in Cornwall, yet the map shown above is based on a 5km squared grid. How can you derive such a detailed resolution from such dispersed measurements?
The paper that appears to explain this remarkable feat is here
https://rmets.onlinelibrary.wiley.com/doi/abs/10.1002/joc.1161
Clear as a bell?
I suspect it simply assumes a smooth 2D temperature field across the UK at all scales and then makes a least fit to the 400 stations. So if UHI has increased since 1976 then that probably also gets folded in as well.
LikeLiked by 2 people
Jaime and Clive
Thanks very much for this – like you, I suspect some shenanigans, in order to achieve their headline.
Like many of us of a certain age I have vivid recollections of the summer of 1976, which I spent (as I did this year) in the far north of England. August 1976 in the far north of England was spectacular – dry and hot. I even remember precisely when the glorious weather broke in 1976. Our family was at St John’s Chapel Show in Weardale, which that year was held in the last weekend in August. It started to rain that day – very heavily indeed – and that was the end of summer.
This year, August has been cool and wet where I live, and the same elsewhere in the far north of England, as I know from speaking to friends scattered around the region. One day in August this year I was out and about in the car, and the car thermometer (during yet another heavy rain squall) told me it was 8.5C (at 3pm). I very much doubt we had temperatures so low in August 1976.
Something definitely isn’t right here.
LikeLiked by 2 people
It’s basically a model then. Which I have no problem with
in principle as long as this is made clear. It never is though
– these are presented as actual physical temperature data.
Does anyone have a simple explanation of how this
reanalysis is validated and verified?
LikeLike
Mark, thanks for that reminiscence of 1976. A lot of people around at the time remember it very vividly as it was so exceptional. There seems little doubt that most of England was hot, sunny and dry throughout most of August 1976 and it all ended abruptly in the very last week. I have a friend from Kent who remembers dancing in the garden in the pouring rain!
LikeLike
Other differences:
1976 2018
UK Population 56M 66M
No. Flights 0.5M 3M
No. Cars 17M 37.5M
Pint of beer 25p £4.50
LikeLiked by 2 people
Clive, no home computers, iPads, mobile phones, X-boxes etc. The Sinclair ZX80 was yet to be invented!
LikeLike
The Met Office have released this video (cringe) explaining how this summer was ‘record-breaking’. I’ve yet to watch it. My initial thoughts are that the Met Office budget didn’t stretch to hiring Ant ‘n’ Dec.
LikeLike
As an inhabitant of Norfolk I feel most deprived. We haven’t had a hottest summer since 1947 (and I was a pre-schooler). I know the rest of the country treats us as backward but there comes a limit. No wonder the Met Office went to Exeter (hottest summer 2018) rather than Norwich. Couldn’t the MetO have used its legendary sleight of hand to bring us into the Anthropocene?
LikeLiked by 2 people
Alan,
I’m just over the border in sunny Lincolnshire and according to the Met Office we’re just inside the 2018 hottest summer region. 15 years ago, I was living in NW Norfolk and we were in the 2003 hottest summer region and I remember that summer well as it was still in full swing when we moved here in late August. I presume that 2003 was the hottest summer here also at that time, superseded now by 2018. I knew they were a bit backward in deepest Norfolk, but really, if we can manage a 21st century hottest summer here, in the village that until recently had more pubs than surnames, when Norfolk can’t even manage to drag itself into the second half of the 20th century, that’s really saying something!
LikeLike
I now deeply regret my 10.30 outburst, because the map shows huge areas of the Welsh Principality that haven’t had the benefit of a hottest summer since 1911! probably no one left alive to remember it. Those poor souls. I think it’s time that Wales devolves a bit more and has its own MetO. Perhaps then they might get an organization that arranges better summer weather.
LikeLike
1911 – a good year for leeks.
LikeLike
The mystery deepens. Here are the published anomalies for the year so far (ref. 1981-2010). As you can see, Aug in England was just 0.7C above the long term average, way behind June and July at 1.8 and 2.6 respectively. Granted, the climate has warmed since 1976, but this really illustrates how August crashed in terms of temperature.
https://pbs.twimg.com/media/DmVNmTlWsAAdW6z.jpg:large
LikeLike
I was programming an IBM Mainframe in Fortran on punch cards. Waiting for the job to run gave me lots of time to do something else like read a book.
LikeLike
Paul Homewood is also bothered about all this:
https://notalotofpeopleknowthat.wordpress.com/2018/09/05/met-offices-hottest-summer-claims-disproved-by-cet/
LikeLiked by 1 person
That’s interesting Mark. Paul has dug out the figures for the Midlands. I didn’t realise the Met Office published the regional figures. Very useful! Yes, the Midlands region geographically coincides almost perfectly with the CET region, yet somehow the Met office data record 2018 as being warmer in that region than 1976, whereas CET says 2018 was half a degree cooler. Something definitely amiss there.
LikeLike
1976, 2018 – hardly a trend, is it?
LikeLike
The heatwave and drought of ’76 were only ended by the astute political appointment of a Minister for Drought.
Wikipedia, Denis Howell:
“In 1976, during Britain’s driest summer in over 200 years, he was made Minister for Drought (but nicknamed ‘Minister for Rain’). Howell was charged by the Prime Minister with the task of persuading the nation to use less water – and was even ordered by No. 10 to do a rain dance on behalf of the nation.
Howell responded by inviting reporters to his home in Moseley, where he revealed he was doing his bit to help water rationing by sharing baths with his wife, Brenda.
Days later, heavy rainfall caused widespread flooding, and he was made Minister of Floods. Additionally, during the harsh winter of 1978–1979 he was appointed Minister for Snow.
Obviously A Man For All Seasons…
Check out the Met Office WOW site:
https://wow.metoffice.gov.uk/
“WOW allows anyone to submit their own weather data, anywhere in the world.”
A nice one in Cumbria, https://wow.metoffice.gov.uk/observations/details/20180906oajbu67tzre6tk8cyyguicqp5y
“Latest Weather Observation information at Strickley, 38.8 °C Temperature, Situated on a dairy farm at Old Hutton.”
The body temperature of a cow is 38.6 °C. Is someone having a laugh?
LikeLike
Dennis, thanks for highlighting the WOW nonsense. Living in Cumbria, I can categorically confirm that we did not have temperatures of 38.8C this morning, nor were we experiencing the 100% humidity also claimed.
Obviously this is a piece of rogue input, but the worrying question is whether the Met office actually include any of this junk data in compiling their results. If so, it might explain why they seem to think this summer has been as hot of that of 1976…
LikeLike
Jaime. I’m sorry for invading your thread, but I don’t trust Benpile not to remove it without trace, as he did to an earlier one. I objected to his snipping the entire content of a posting from Brandon Shollenburger. My argument was a simple one – that we, the readership often learn much from the interchange between someone like BS and other contributors (think about exchanges with ATTP). As I am a regular contributor this posting was accepted immediately. However, within hours, it had completely disappeared, no trace whatsoever. Slightly irritated, I chose not to object, especially because I have clashed swords with BP before.
But now BP has removed all trace of BS’s presence, removing the “discussion” wholesale from his blog.
One of the most admirable features of this site has been the lightness of touch with regard to moderation. This appears to be changing and for the worse.
Once again my apologies for invading your space. It perhaps justifies the suggestion I have made several times for a venue on this site, like BH’s Unthreaded.
LikeLike
Alan, I think it would be a good idea to have a discussion thread on moderation practices. Without wanting to take sides, from what I saw of Brandon’s contribution, it appeared to be, as is his wont, rather pointless nitpicking that was detracting from the main point of the article. Ben chose to excise the conversation from the thread, as is his privilege, as author of the main article. That’s how we operate on Cliscep – moderation is generally very light but up to each individual author. The first I knew of these goings-on was yesterday, when Brandon appeared on Twitter, smearing the entire Cliscep site as a bunch of “skeptics”, saying he’d been permanently banned (which he hasn’t), and tagging me specifically in the thread.
LikeLike
I’ve just been looking at the back catalogue, and found this oldie but goldie by Jaime Jessop back in 2018. It’s very interesting to see the modus operandi of the Met Office then (establishing a 4th hottest summer in the UK, hottest ever in England) with its MO today (joint hottest summer). Some things never change, it seems.
LikeLiked by 1 person
Hi Mark. Thanks for the h/t.
Very strange. I’m suddenly getting notifications from WordPress on old Cliscep posts. There’s still a mismatch and now the Met Office tell us that Summer 2022 was jointly as hot as 2018 in England – although they sneakily put it as first by citing a statistically meaningless 2nd decimal point. Optics. It’s all optics. 1976 is still King of the Summers in Central England.
https://jaimejessop.substack.com/p/1976-summer-is-still-the-hottest
LikeLiked by 2 people
Paul Homewood pointed out at the time that the Midlands region was geographically more or less identical with the Central England region, so we should expect them to be very similar in terms of temperature recordings. Well, this year 2022, the Midlands managed 17.09C, ahead of 1976 at 17.01C, but behind 2018 at 17.19C. But in CET, 1976 is 17.7C and 2022 is recorded as 17.3C. So the discrepancy is 0.48C in total between the two datasets, which is still considerable.
Therefore, it very much looks like the Met office is still relying upon a dubious dataset to make these claims of ‘hottest summer ever’ in England.
https://www.metoffice.gov.uk/pub/data/weather/uk/climate/datasets/Tmean/ranked/Midlands.txt
LikeLiked by 2 people