AR6: Shared Socio-Economic Pathways Make Climate Models Increasingly Redundant
Climate models were supposedly the future of climate change research. Their use heralded a new golden age of scientific understanding according to former Met Office chief scientist Dame Julia Slingo:
I think today the incredible complexity and power and skill of these models that we use . . . . they are one of the great achievements of modern science and you realise that we are entering I think a Golden Age for climate science. And it’s good that we are because we have some really really big questions to answer for the world.
Contrary to that, what appears to be actually happening is that ‘soft’ socio-economic models are gradually stealing the thunder of complex global circulation climate models based on hard physics.
Socio-economic projections have formed the backbone of IPCC GHG emissions since the early days of IS92 scenarios in AR2. They progressed through to the SRES scenarios, thence to the RCP scenarios in AR5, which were developed using complex IAMs (Integrated Assessment Models) in conjunction with a simple energy balance climate model called MAGICC ( Model for the Assessment of Greenhouse Gas Induced Climate Change). Now we have the most complex incarnations of socio-economically projected emissions scenarios which include mitigation and adaptation as well as ‘baseline’ GHG concentrations generated in the absence of any carbon reduction measures.
The so called Shared Socio-Economic Pathways will be show-cased later this year in a Special Report by the IPCC on the impacts of a 1.5C warming above pre-industrial levels. The CMIP6 ensemble of up to the minute high resolution complex coupled AOGCMs presumably will not take centre stage until April 2021 when WG1 The Physical Science Basis reports. By then, I imagine we will all have been told ad nauseum how runaway catastrophic warming of up to 5.1C by 2100 is a real possibility if we do not urgently reduce fossil fuel use. So I wonder, what additional catastrophic climate change projections will the CMIP6 climate model ensemble have to tell us that we’re not going to hear about between now and 2021, courtesy of the all-new SSPs? Not a lot I suspect.
The IPCC appears to be rapidly switching emphasis from the science (which, it is implicitly claimed, is now largely settled, barring a few minor tweaks here and there, and improvements to models) to socio-economic projections and associated mitigation/adaptation strategies. Literally, they are telling us our future survival depends upon how we choose to live in the next 80 years, because the science of AGW is basically done and dusted and we know enough about how the climate changes naturally to be able to now project reliable estimates of future warming based mainly upon anthropogenic GHG concentrations (derived via emissions scenarios). Nothing could be further from the truth.
Zeke Haufather has written a very readable summary of the main aspects of the new SSPs, of which there are 5, labeled, unsurprisingly, SSP1-SSP5.
These SSPs are now being used as important inputs for the latest climate models, feeding into the Intergovernmental Panel on Climate Change (IPCC) sixth assessment report due to be published in 2020-21. They are also being used to explore how societal choices will affect greenhouse gas emissions and, therefore, how the climate goals of the Paris Agreement could be met.
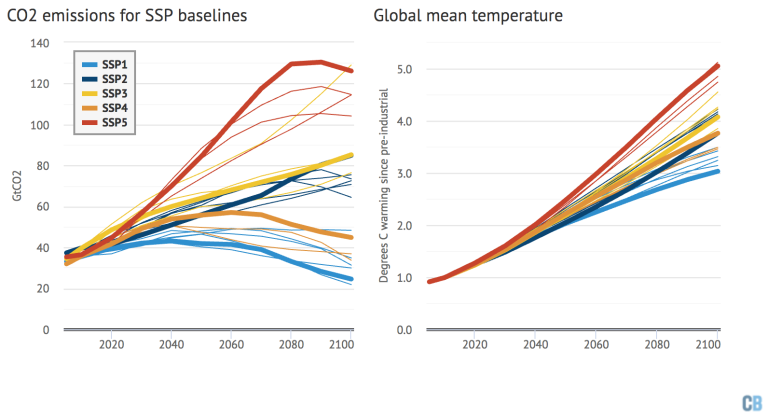
The new SSPs offer five pathways that the world could take. Compared to previous scenarios, these offer a broader view of a “business as usual” world without future climate policy, with global warming in 2100 ranging from a low of 3.1C to a high of 5.1C above pre-industrial levels.
The point to note here is that, yes, the SSPs do feed into the CMIP6 ensemble of climate models to generate a whole range of different climate projections. But, the range of 3.1C to 5.1C warming which Zeke mentions here is generated by just one climate model (MAGICC) having a sensitivity of 3C, with the differing amounts of warming dependent only on the particular emissions scenarios and the consequent GHG atmospheric concentrations plus the climate feedbacks associated with that one model. The reason that MAGICC is used in this way is not specifically to project a climate response; it is because an estimate of the climate response is needed because the carbon cycle – and hence the GHG concentrations – are affected by the amount of warming. Arguing this on Twitter in the case of RCPs resulted in Steven Mosher calling me a moron and shit for brains because he disagreed. Charming. If you’re reading Steven, your pal Zeke confirms that you were wrong:
The RCPs set pathways for greenhouse gas concentrations and, effectively, the amount of warming that could occur by the end of the century . . . . .
The simple climate model MAGICC was used to convert greenhouse gas emissions from the IAMs into atmospheric concentrations and future warming.
The plain truth is, because MAGICC emulates closely the CMIP3 model ensemble and is used with a sensitivity close to the multi-model mean of that ensemble, the climate responses it generates are useful pointers as regards what one might expect when the projected GHG concentrations generated from the emissions scenarios are plugged back into more sophisticated climate models. So although scientists are at pains to point out that the RCPs (and now the SSPs) are not actual climate projections, that is effectively what they are, albeit less sophisticated ones.
After the passage quoted above, Zeke goes on to say:
They show that it would be much easier to mitigate and adapt to climate change in some versions of the future than in others. They suggest, for example, that a future with “resurgent nationalism” and a fragmentation of the international order could make the “well below 2C” Paris target impossible.
If this doesn’t ring alarm bells about what is motivating the UN IPCC and its development of the new SSPs, I don’t know what will. The UN are clearly envisaging in the not too distant future the development of a globalist political infrastructure which will override nationalist concerns.
The impetus for the development of the broader, more complex socio-economic ‘narratives’ of the SSPs (in contrast to the narrower focus ’emissions pathways’ of the RCPs) appears to be to demonstrate how mitigation combined with adaptation can work to avoid the nightmare futures which climate models predict on the basis of no mitigation whatsoever and the unrestrained use of fossil fuel reserves (the baseline scenarios). They tell us how it could all be reasonably OK if we mend our wicked ways and start seriously mitigating. In that respect the contrast between SSP1 and SSP5 is telling:
SSP1 and SSP5 envision relatively optimistic trends for human development, with “substantial investments in education and health, rapid economic growth, and well-functioning institutions”. They differ in that SSP5 assumes this will be driven by an energy-intensive, fossil fuel-based economy, while in SSP1 there is an increasing shift toward sustainable practices.
SSP narratives
SSP1
Sustainability – Taking the Green Road (Low challenges to mitigation and adaptation)
The world shifts gradually, but pervasively, toward a more sustainable path, emphasizing more inclusive development that respects perceived environmental boundaries. Management of the global commons slowly improves, educational and health investments accelerate the demographic transition, and the emphasis on economic growth shifts toward a broader emphasis on human well-being. Driven by an increasing commitment to achieving development goals, inequality is reduced both across and within countries. Consumption is oriented toward low material growth and lower resource and energy intensity.
SSP5
Fossil-fueled Development – Taking the Highway (High challenges to mitigation, low challenges to adaptation)
This world places increasing faith in competitive markets, innovation and participatory societies to produce rapid technological progress and development of human capital as the path to sustainable development. Global markets are increasingly integrated. There are also strong investments in health, education, and institutions to enhance human and social capital. At the same time, the push for economic and social development is coupled with the exploitation of abundant fossil fuel resources and the adoption of resource and energy intensive lifestyles around the world. All these factors lead to rapid growth of the global economy, while global population peaks and declines in the 21st century. Local environmental problems like air pollution are successfully managed. There is faith in the ability to effectively manage social and ecological systems, including by geo-engineering if necessary.
Both worlds are socially and economically attractive. The one involves being more ‘responsible’ and thus involves the least challenges presented by adaptation to and mitigation of climate change. The other involves massive global economic development reliant upon fossil fuel reserves resulting in global warming of up to 5.1C (above pre-industrial) by 2100. This means that this ‘plausible’ socio-economic scenario will result in global warming of 4.1C over the next 82 years! Readers can decide for themselves whether that sounds plausible or not. The projected fossil fuel use in SSP5 is actually greater than that in the RCP8.5 ‘worst case scenario’, which was itself scarcely believable and which was, according to Doug McNeall of the Met Office, in answer to Matt Ridley, mainly of use to tease out a signal:
I can almost guarantee that SSP5 will be similarly misused and its integral (and technically necessary) climate responses to varying emissions scenarios used as projections of future nightmarish climate scenarios, long before SSP5 is plugged back into the CMIP6 ensemble to generate a much wider range of possible climate futures. This graph proves it’s already happening:

Denier!!!! I don’t know how to stress that enough.
LikeLike
One other issue that is implicit in MAGICC, but is never spoken out: it assumes a Bern carbon cicle model which has saturating sinks, so that emiisions result in high atmospheric concentrations.
In reality the airborne fraction has been constant at about 50% with no sign of alarmistic change.
I calculated the shocking difference for the SRES emissions.

LikeLiked by 2 people
Does anyone know if the pension pots of these climate modellers include investment decisions that incorporate information from projections from the different socio-economic scenarios that they blithely use?
Shouldn’t they?
LikeLike
The abuse and misuse of the RCP data is nearly never commented on the consensus opinion leaders.
And the source of the scary deceptive stories is the consensus community itself.
So it is reasonable for skeptics to point out how the climate community relies on hyperbole and fiction to push their alarmist claims.
LikeLike
‘soft’ socio-economic models are gradually stealing the thunder of complex global circulation climate models based on hard physics
Meaning climate models have been largely discredited, so we’d better switch to something else.
LikeLike
In the earluest days of Christianity, a popular belief was that Christ was coming back *soon*, as in the lifetimes of the earliest believers.
Reality foeced a change in the theology, leading to convoluted explanations of the awkward texts.
LikeLike
Scenarios are supposed to span the range of possible futures. SSP5 assumes essentially that transport and heat will be electrified and that power-generation will be predominantly coal-based.* The latter assumption looks tenuous at the moment, as coal can’t compete with gas, wind and solar, but the energy market is infamous for blips mistaken for trends.
*Alternatively, gasified and liquefied coal may become major players.
LikeLike
If you want to play with the ssp scenario data, here is the link to the database:
https://tntcat.iiasa.ac.at/SspDb/dsd?Action=htmlpage&page=series
LikeLike
Ah, more computer games!
Are they available for Xbox yet?
LikeLike
OLDBREW,
On the subject of climate models, several papers recently published demonstrate just how badly they are performing in specific areas:
http://notrickszone.com/2018/05/17/6-new-papers-climate-models-are-literally-worth-zero-even-water-vapor-feedback-does-not-exist/
LikeLiked by 2 people
Models! Full of
ASSumptions ‘n
don’t do clouds
LikeLike
Beth
In our models
Clouds are paramilitarized
And do our bidding
LikeLiked by 1 person
The new scenarios seem to have the same fundamental flaw as the RCP scenarios. They treat the world as a unitary body of all-powerful decision-makers. It only takes from some to “lead the way” to change the global future. Politically the fundamental decision-making bodies are countries. Countries have different circumstances and different, often competing priorities. That competing priorities are both internal and external. Globally the biggest conflicting priorities to reducing global emissions are:-
(a) Emerging / developing countries using cheap fossil fuels as a driver of long-term economic growth.
(b) Oil and gas-dependent economies losing their major source of government revenue.
“Developing economies” with over 80% of the global population and now around two-thirds of global emissions have not signed any binding agreement to reduce their emissions. So when the modellers and the policy-makers speak about what “we ought to do” they are not speaking for these countries. They just live in a fantasy land of scenarios.
The activists are worse. They try to shut down oil companies in the United States and production of gas through fracking in the USA, but do little or nothing to convince Russia and states in the middle-east to destroy their economies by leaving their vast reserves of oil, gas and coal in the ground.
LikeLiked by 1 person
In the run-up to the COP21 Paris in December 2015 showed the huge gulf between scenarios and political realities. Countries made submissions about intended policies up to 2030. Collectively if these intentions were fully implemented, they would not stop global emissions rising. The impact on global emissions to the end of the century (hence any consequent emissions rise) would be very small indeed. Maybe one or two-tenths of a degree off the projected 4.5C of warming to 2100. Yet in the run-up to COP21 UNFCCC Executive Secretary Christiana Figueres was reported by the BBC as saying
It took a lot of searching to find where Figueres got that 2.7C figure. The UNFCCC Synthesis report on the aggregate effect of INDCs made no attempt to bridge the 70 years from the period covered by the INDCs to the end of the century. For that one needed to look in the separate Technical Annex, section M. Summary of results from other studies. Even then the text does not mention 2100, but table 6 mentioned studies that did. Two of them had the 2.7C figure.
So how did the two studies bridge to 2100? For one – Climate Action Tracker (CAT) – I could find no justification. The other was from the IEA. The IEA press release explained the methodology.
That is the International Energy Agency took two fantasy scenarios, averaged them, and spliced them onto the INDC submissions. These scenarios will remain fantasies until the UNFCCC can persuade
(a) Emerging / developing countries using cheap fossil fuels as a driver of long-term economic growth to change course.
(b) Fossil fuel producing countries to commit economic suicide.
The claim made by Christiana Figueres on the impact of the INDCs was false. The conference should have been told that the INDCs were in reality virtually useless. It is only in the quite separate and virtual realities of the RCP scenarios that any difference is made.
I detailed and referenced the claims made above in November 2015.
https://manicbeancounter.com/2015/11/29/unfccc-massively-overstates-impact-of-indcs-on-2100-emissions/
LikeLiked by 1 person
A chronology of emission scenarios
* 1% exponential increase
* IS92A
* SRES A1B A1T A1FI A2 B1 B2
* RCP 2.6 4.5 6 8.5
* SSP 1 2 3 4 5
WHY?
LikeLike
As an illustration of just how unrealistic and idealistic the SSPs really are, I quote Zeke again, via the reference above:
“Finally, SSPs provide estimates of how the world will become more urban in the future. This ranges from a low of 60% of the population living in cities in 2100 in SSP3 – similar to today’s rate of 54% – to up to 92% in SSP1, SSP4, and SSP5. SSP2 is in the middle, reaching 80% urbanisation by 2100.”
This is the UN’s Agenda 21 – the herding of the world’s population into urban ‘control zones’. I suggest it is more an aspiration of global governance than the projection of long term trends towards increasing migration from the countryside to towns and cities. How else can you explain the migration of nearly 40% of the world’s population from rural to urban centres in just 80 years? It suggests to me that people would need to be ‘actively encouraged’ or compelled to leave the land and their rural villages in order to be squeezed like sardines into teeming, populous cities.
LikeLiked by 1 person
Hans,
The initial scenario of 1% exponential growth in emissions turned out to be too low. From 1990 to 2012 it was nearer the 1.5% growth used in Hansen et al 1988 Scenario A. That is the one with the greatest warming.
Click to access 1988_Hansen_ha02700w.pdf
The actual emissions growth was below 1.5% growth in the 1990s and above that level in the 2000s. The pattern of warming was the opposite. Emissions growth delinked from warming, having only linked loosely correlated with warming from the mid-1970s.
The reason for the increase in emissions growth was largely due to China, but also due to a emissions growth in a lot of other countries. The pattern of global emissions growth could not have been predicted 25 years ago. But more emissions growth would always have happened in the developing countries than the developed countries. Politically it meant that to achieve emissions reductions would always require including those countries where most of the global population live. Bashing American oil companies, or getting EU citizens to recycle more, will make no substantial difference to the long-term global emissions growth picture.
LikeLiked by 2 people
Jaime@ 9:07 am
I also share your belief that the SSPs are “more an aspiration of global governance than the projection of long term trends towards increasing migration from the countryside to towns and cities.” More generally, there is a general mindset of talking about what “we” should be doing – meaning all 7.5 billion people on the planet in the case of climate mitigation. This is fine for some vague modelling, but to actually achieve the policy objectives in the aggregate, the believers must convince governments to implement policies at national levels. After more than 25 years of trying the alarmists have failed. Rather than admit their failure, they find different ways to order the world. The consequence is that countries like the UK have costly and useless policies. The countryside is being ruined, energy poverty is rising, households are having to sort out waste in multiple bins and businesses have ever-rising regulations and costs, all so that Britain can be seen to be doing its bit to “save the planet”.
LikeLiked by 1 person
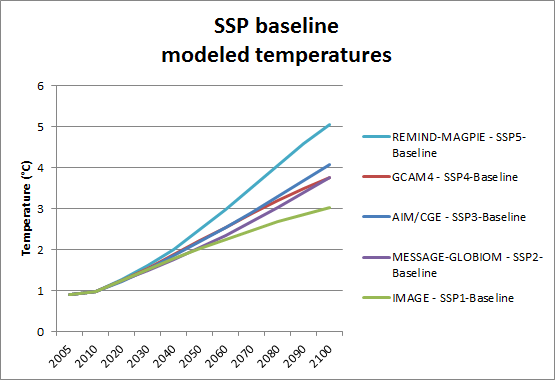
I had a detailed look at the SSP scenario data, in particular I calculated the implicit climate sensitivity, given the forcing values and the temperature values of the five baseline scenarios
https://tntcat.iiasa.ac.at/SspDb/dsd?Action=htmlpage&page=series
This is the published modeled temperature result of the five scenarios
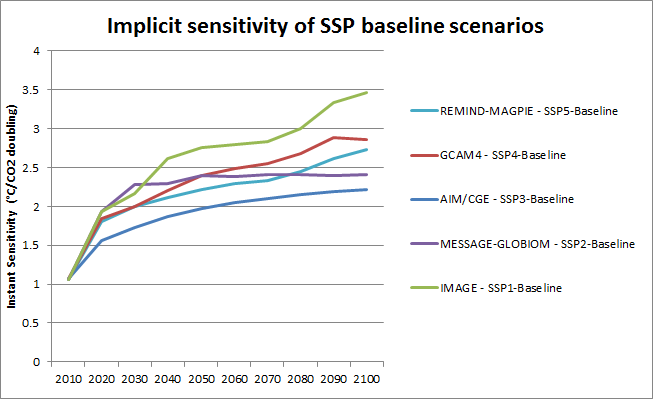
These are the implicit decadal sensitivitiies, given a CO2 doubling forcing of 3.7 W/m2
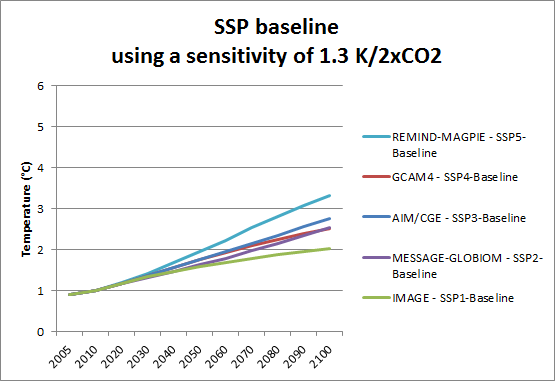
This is the temperature using the the same SSP forcing, but using a sensitivity of 1.3 K/2xCO2
LikeLiked by 1 person
Next project: the implicit sink saturation in the SPP scenarios.
LikeLike
I know of the Mauna Loa, Barrow and South Pole CO2 measurements, but where is the “official” record of “global” co2 where the scenarios can be validated with. Same for the “official” “global” temperature.
LikeLike
Hans. You mean it isn’t out of thin air? Or perhaps a massage parlour? (Snigger).
LikeLike
Hi Alan, we saw a lot of scenarios showing up in the past thirty years, but where is the data to validate these scenarios? Where is the realisation scenario?
LikeLike
I know Hans. I was a strong advocate of Peak Oil (in some respects l still am) and had many discussions with CRU personnel as to whether there were enough fossil fuel reserves to support the validity of many of the scenarios. We never came to any agreement but then they were fairly ignorant about reserve scenarios.
LikeLike
Alan,
With respect to the quantity of emissions from proven fossil fuel reserves, the relevant article in McGlade and Ekins 2015 “The geographical distribution of fossil fuels unused when limiting global warming to 2 °C” (doi:10.1038/nature14016). They estimated that these reserves were sufficient to produce around 3000 GtCO2 of emissions, or three times the emissions that AR5 was estimated sufficient to produce 2C of warming.
There was no breakdown by country, so I used the BP estimates of proven reserves (which are similar) to look at the major countries.
McGlade and Ekins further estimated that unproven, but potentially recoverable reserves of fossil fuels could emit a further 8000 GtCO2. Even then this could be an underestimate. For instance, potentially recoverable reserves of tar sands in Canada and Green River Basin Wyoming, heavy oil in Venezuela and shale oil in Saudi Arabia could each be similar to or exceed, the current global proven reserves of oil. These global proven reserves are equivalent to over 50 years of current production.
The problem for those wanting to keep fossil fuels in the ground is how geographically dispersed they are. The major constraints on production are political and economic.
https://manicbeancounter.com/2017/11/22/the-supply-side-of-climate-mitigation-is-toothless/
LikeLike
Manic. It has been quite a few years since I looked into the question of fossil fuel reserves but I recognize many of those you mention. If they are properly evaluated, they evaporate away. For example, the Green River oil shales have been investigated for many years by many different oil companies – all unsuccessfully. In situ retorting works in one test, but the next, under seemingly identical conditions, is a miserable failure. Furthermore, the process requires water in huge quantities of which Wyoming , Utah are rather deficient (I suspect Saudi even more so). Many of these reserves are actually resources and are not currently viable.
Even if the reserves were to be physically present, much of them will never be produced, let alone used. What many critics of Peak Oil fail to recognize, is the shortage is in cheap oil. There may be available supplies, but the cost of getting them increases. A point may be reached where oil could be supplied but few could afford it. This produces peak oil demand, not peak availability. Nevertheless it means that many of the resources you mention will stay in the ground. Mind you, people said that about shale gas.
LikeLike
Just like ice, soon synthesising will be cheaper than mining, nobody is mining ice anymore.
Synthetic fuel will be created using energy from laser microfusion, within 40 years.
LikeLike
Alan@ 21 May 18 at 6:41 pm
Whilst much of the potential oil resource will never be recovered, it needs to be put into the context of what climate mitigation policies. In round figures, the IPCC reckons the 2C warming target will be breached with broadly 1000 GtCO2e of emissions from 2012. CO2 emissions are roughly 40 per year, GHG emissions 50-55 per year. Climate Armageddon starts in 15-25 years from now.
From the BP Statistical Review of Energy 2016 at current production levels, proven reserves are 50.7 years of oil, 52.8 years of gas and 113 years of coal. Even without exploiting as yet unproven resources, the climate alarmists are not going to achieve their objectives unless they can convince a vast number of countries to leave the resources in the ground. Below is proven reserves of oil in terms of years of global production.
The bald figures talked about for potentially recoverable reserves of tar sands in Canada and Green River Basin Wyoming, heavy oil in Venezuela and shale oil in Saudi Arabia, if fully exploited would add maybe 250 years to oil production. The reasons that constrain current production are economic and political. For instance, shale. deep water, tar sand production was constrained by high costs. Many years of development, plus a few years of high oil prices resulted in these methods becoming economic on a large scale. Shale oil production in Saudi Arabia is likely decades away. By then the lack of water will be less likely to be an issue either through lower cost desalination, or using filtered seawater.
In the near future, high prices from the return of sanctions in Iran and OPEC price rigging will provide incentives to further increase production elsewhere. An increase in production in Venezuela or Brazil (with newly discovered deepwater reserves) is unlikely to happen due to local political difficulties.
But the major constraints on fossil fuel production will always be economic. Absolute amounts of fossil fuels are vast, and mostly waiting to be discovered. An example. The 113 years of coal reserves was arrived at by dividing 891531 mt of reserves by 7861 mt of production in 2015. There is estimated to be between 3 and 23 trillion tonnes of coal beneath the North Sea. A little tricky to get at maybe, but could alone keep global output going into the next millennium. So when the oil runs out there is this vast resource. Turning coal into liquids requires 4 to 5 tonnes of coal for a tonne of product and produces much more CO2 than generating electricity from coal. But a few years ago it was economic in China if the oil price was above $60 a barrel. Whilst in the West it might be politically incorrect to do so, politically the priorities are different elsewhere. I looked at an example from China a few years ago.
https://manicbeancounter.com/2013/04/30/chinas-renewable-policy-in-context-the-ningxia-example/
LikeLiked by 1 person
Manic I’m not going to continue this debate, not because I don’t have counterarguments but simply because I left my interest in Peak Oil behind when I stopped teaching. If you believe in it it’s too depressing. I never understood why support for Peak Oil disintegrated. Yes, shale gas and shale oil came along, but they were initially expensive and only really viable when oil prices are high.
Your source of data is the annual assessment of reserves and resources by BP. Whereas this is the best available it is not gospel. I’m sure it hasn’t changed since I consulted it, you should look at the sources that the BP Annual Review uses. For most of the Middle East this is information provided by the state or the state oil companies. Since the export quota for OPEC was determined by the quantity of oil reserves each country had, each country inflated its current reserves. One country reported unchanged reserves for more than a decade despite their being no exploration activity and exporting like gangbusters. Some of the data presented by BP is simply not believable, and BP used to acknowledge this.
Proof of the overinflation came from Kuwait. After Kuwait was liberated the USA insisted that it properly report its real oil reserves. When it did so, if I remember correctly, its reserves dropped by more than 50%. It was generally believed at the time that all Middle East oil producers used similar falsehoods, but no one knows.
LikeLike