Scientists Mock Rose’s Graph of Modeled vs. Actual Warming
 Wikipedia apparently has decided to ban news items from the Daily Mail as unreliable sources of information. Much gloating in the Guardian – naturellement. The news apparently inspired Richard Betts on Twitter to post this tweet:
As you can see, Ed Hawkins, Tamsin Edwards and Doug Mc Neall were tagged in and it’s been retweeted 502 times so far. Tamsin and Richard have pinned the tweet to their profiles. Obviously, Rose-bashing is popular in the climate science consensus fraternity and I’m sure the Wiki Mail ban has warmed the cockles of many a warmist heart. Here is Rose’s original graph from his March 2013 article, which shows annual mean global surface temperatures (black line) plotted against CMIP5 model projections (I assume annual projections):
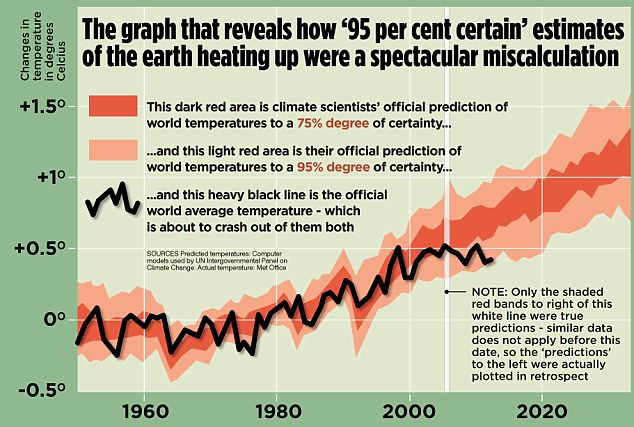
OK, the doctored graph is amusing, but it’s a bit unfair for a couple of reasons. Firstly, nearly three years ago, the situation re. global warming was very different, the Pause was in full swing and real temperatures were heading outside of the 95% envelope, so the models certainly did look like they were performing very badly at the time, especially as there was no satisfactory physical explanation for the lack of warming.
The second reason is a bit more serious. 19 months after Roses’s article, in October 2014, according to NOAA, the central Pacific passed the threshold for El Nino and exceeded that threshold continuously until June 2016, averaging more than 0.5C for 19 consecutive three month periods – the longest El Nino in the record stretching back to 1950, and also arguably the most powerful event in that record. So a pretty significant episode of natural warming came a year and a half after Rose’s article, which bumped global temperatures up to record highs in 2015 and 2016. Obviously, nobody, Rose included, could have foreseen the extent of the natural warming caused by the super El Nino of 2014/16. So, is information to be judged unreliable by Wiki now, simply because of the lack of contrary evidence at the time?
Coming back to Richard’s amusing – but somewhat deceptive – graph, we see that warming appears to be bang on target, even to the extent that reality is now firmly in the middle of the red 75% zone:
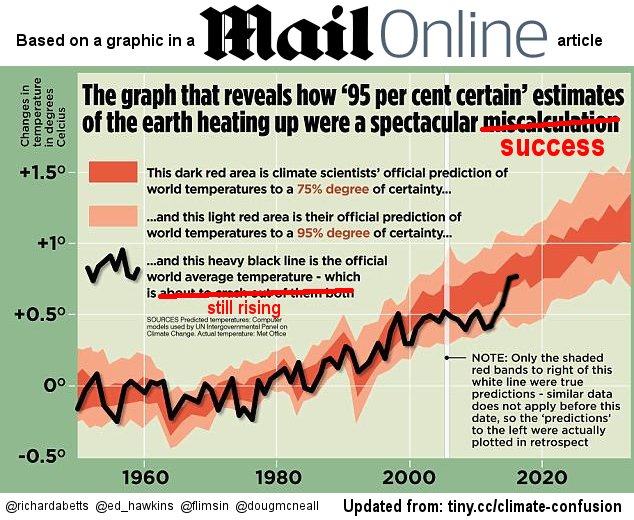
Naughty Richard. The claim that the black line is still rising is unsubstantiated and very probably wrong. 2017 is unlikely to exceed 2016 annual mean global temperature. So the black line will fall. Also, by the Met Office’s own admission, 2016 annual average temperature anomaly benefited to the tune of approx. 0.2C due to El Nino. So the last data point on that black line, were it not for El Nino, would have been around the 0.57C mark, similar to 2014, in the lower reaches of the 95% confidence interval. Actual underlying warming then would still be way behind the range of IPCC model projections and Rose, in 2013, though not vindicated as to his claim of ‘spectacular miscalculation’ would nonetheless still be able to say that the models have miscalculated in that they continue to consistently underestimate the rate of warming.

I suppose this is another example of climate scientists behaving with dignity and professional gravitas. It must be why we have such great respect for them.
LikeLike
The Met office is understating the El Nino effect on GMT:
https://rclutz.wordpress.com/2017/01/20/oceans-make-2015-2016-climate/
LikeLiked by 1 person
Surely these people know that somebody will update that graph in 6 months or a year, and what it will show then. According to satellite data, the global temperature anomaly has *already* dropped ~ 0.5C from the El Nino peak and a further drop is entirely possible. The peak-to-trough drop after the 1998 El Nino was ~ 0.8C.
The alarmists milked the upswing of the El Nino for all it was worth, as if they did not know that a subsequent downswing is inevitable. It smells of desperation.
LikeLike
Either way, Tom, they come across as rather mediocre
LikeLike
You mean that PAUSE that still exists and is still going on and that NASA was just discovered to have FAKED its disappearance.
LikeLike
Of course they are not talking about the balloons and satellites.

A closer look into how the models behave:
Over the entire 240 years time series, the average model has a warming trend of 1.26C per century. This compares to UAH global trend of 1.38C, measured by satellites since 1979.
However, the average model over the same period as UAH shows a rate of +2.15C/cent. Moreover, for the 30 years from 2006 to 2035, the warming rate is projected at 2.28C. These estimates are in contrast to the 145 years of history in the models, where the trend shows as 0.41C per century.
Clearly, the CMIP5 models are programmed for the future to warm more than 5 times the rate as the past.
https://rclutz.wordpress.com/2015/03/24/temperatures-according-to-climate-models/
LikeLike
Richard B is safely ensconced in an ivory tower and in the Met Office, and from there he can contrive amusements for his chums such as the modified graphic shown above. If he took critics like Rose as seriously as he deserves to be taken, then he would not have so much fun with climate scares and speculating about just how bad it might get with rising CO2 levels.
If my memory of comments of his at BH is right, his fallback position when challenged is that our rising CO2 emissions might possibly be a problem and therefore it is ok to spend lots of money on it, for him in particular of course, as well as all the rest of them. This stance grows weaker year by year, but it could well see him, and at least his older chums, through to retirement.
LikeLiked by 1 person
Why would anyone pay attention to whatever Richard Betts may claim?
LikeLike
Richard Betts gave up doing science a long time ago. He is one of a long list of hypocrites who should be drained from the swamp and put behind …. I don’t know how these people can look at themselves in the mirror without thinking about the damage they have done due to their personal greed. They have contributed to ruining millions of peoples’ lives.
LikeLiked by 1 person
“Oh no! Not only do observation and data not support the underlying global warming hypothesis the models are built on, now Anon Y. Mitty” says ‘So kvetching about conkvetchion is beside the point.”
Anon has a point!
The underlying global warming hypothesis the models support has always been based on the mistaken Idea that IR-EMR exit flux originates at Earth’s surface. The S-B equation now can be used to show that the minimum radiometric temperature of whatever is ‘radiating’ must be at least 255 K, but the surface has a higher thermometric temperature. The atmosphere is measured to have temperatures bracketing that minimum, thus demonstrating that exit flux originates somewhere in the atmosphere. Never from the surface.
LikeLike
Continued:
Can we all go back to sleep and put this scam behind us? It is the on and on kvetching about atmospheric CO2 levels that encourages the inherent human trait of scamming others for fame or profit! There is absolutely no ‘science’ whatsoever in any of the CAGW SCAM!
LikeLike
@John Shade
David Rose and I discuss this kind of thing fairly frequently on twitter and occasionally in person, without resorting to the flaming and ill-feeling that is an all-too-common distraction in the climate debate. I think that as grown-ups we can have different opinions and tell each other when we disagree – here I admit it was done a bit cheekily but we felt the graph did need to be brought up to date. Others have already published similar comparisons, we just did it in the style of the Mail On Sunday original. The model-data comparisons can of course keep being done, and the next few years will be very interesting. I think we all know that it’s the long-term trend that counts.
Richard
LikeLike
Richard Betts says: 10 Feb 17 at 5:07 pm
” I think we all know that it’s the long-term trend that counts.”
The long term statistical nonsense ‘global average temperature’ counts only for those promoting the scam! You are supposedly learned! Can you give us a technical definition of thermometric, thermodynamic, or radiometric “temperature”?:
LikeLike
Yes Richard, what counts is the long term trend; whether, after the current El Nino ups and downs, it continues to show a Pause which can be adjusted away in the surface, but not satellite data, whether warming pauses at a new global high a few tenths of a degree above the most recent hiatus, or whether rapid warming takes off again, rapid enough to restore faith in the IPCC model projections. There is also the Unmentionable possibility of cooling during the next 5-10 years. Like you say, the next few years will be very interesting.
LikeLike
Stephen McIntyre has posted his own version of Richard’s/David’s graph on Twitter, which shows the models vs. obs in a rather different light. TLT in particular looks catastrophically bad.
LikeLike
I’m amazed at Betts and Edwards lending their names to this campaign. Look at the note bottom right on the graph. It says: “Only the shaded red bands to the right of this white line were true predictions – similar data does not apply before this date, so the ‘predictions’ to the left were actually plotted in retrospect.” In other words, on Rose’s original graph, almost the whole of the 55 year retrodicted plot is within the 75% degree of certainty, and the whole of the (8 to 10?) year predicted plot is outside. Rose was right – then – for 8 to 10 years. Betts is right – now- for two years. El Nino has passed his climax, but we haven’t yet seen La Nina’s bottom. Betts is risking looking silly.
I have much respect for Professor Betts ever since he apologised to me on a BishopHill thread for allowing himself to be quoted in one of the Guardian’s imminent doom articles.
LikeLike
“Much gloating in the Guardian ….”
The rag which (in 2004) gleefully reported:
“A secret report, suppressed by US defence chiefs and obtained by The Observer, warns that major European cities will be sunk beneath rising seas as Britain is plunged into a ‘Siberian’ climate by 2020. Nuclear conflict, mega-droughts, famine and widespread rioting will erupt across the world.”
https://www.theguardian.com/environment/2004/feb/22/usnews.theobserver
LikeLike
WJanoschka asks
“Can you give us a technical definition of thermometric, thermodynamic, or radiometric “temperature”?:
Somewhat awkwardly put but Eli is always glad to help:
Thermodynamic temperature is defined by the theoretical maximum efficiency of a heat engine operating between two temperatures. It is equivalent to the temperature defined by an ideal gas thermometer.
Radiometric temperature is defined by the characteristic temperature of radiative emission from a body at according to the Planck radiation curve
Thermometric temperature is an odd term, unless you mean the temperature as measured by any physical device.
LikeLike
“Much gloating in the Guardian – naturellement.”
Perhaps is related to the fact that in Jan 2016 Jimmy Wales joined the Guardian board as a non-executive director…
LikeLike
Richard makes the point that it’s all a bit of a joke and that he and David Rose have spoken and are perfectly capable of agreeing to disagree like adults, and indeed have agreed to disagree like adults. This I do not doubt. What I doubt is that other less scrupulous individuals will take this tweet as proof that the Daily Mail is not to be trusted on climate-related issues, especially those articles authored by Rose. Let us also not forget that the House Science Committee in the US has retweeted Rose climate change articles in the past and that if Rose’s credibility is brought into question – however good-naturedly – then so also by default is the reputation and credibility of the House Science Committee for its referencing of climate change journalism in the Mail.
LikeLiked by 2 people
“I’m amazed at Betts and Edwards lending their names to this campaign.”
I said the same thing. Richard said to take it lightheartedly.
The issue has a serious dimension though.
If models predicted a low rate of warming, they wouldn’t support alarm. But they would match reality more closely. This goes to the heart of the debate.
LikeLiked by 1 person
Apologies Shub. No idea why your comment went into moderation.
LikeLike
Eli Rabett says: 10 Feb 17 at 9:24 pm
“Thermodynamic temperature is defined by the theoretical maximum efficiency of a heat engine operating between two temperatures. It is equivalent to the temperature defined by an ideal gas thermometer.”
Self referential; “between two temperatures”. Measurements of somdamned thing!
“Radiometric temperature is defined by the characteristic temperature of radiative emission from a body at according to the Planck radiation curve”
Self referential; “the characteristic temperature”. Measurement of somdamned thing!
“Thermometric temperature is an odd term, unless you mean the temperature as measured by any physical device.”
Self referential; “the temperature”. Measurement of somdamned thing!
Can Richard Betts or anyone else tell\define for the rest of us, just what may physically be that “somdamned thing”, that is being measured? Is the word ‘temperature’ only a fantasy created by meteorologists as the scam that results in fame and\or profit?
LikeLike
Will,
The change over time of global mean surface ‘temperature’ is a convenient – though not particularly relevant and certainly not that accurate – measure of energy supposedly accumulating in the earth system. It isn’t a measure of ‘climate change’. Firstly, there is no such thing as a ‘global climate’ and hence no such thing as global climate change. Regions have distinct climates, which change over time, and the causes of those changes are a lot more complex than simply energy supposedly accumulating in the total earth system. Which technical definition of ‘temperature’ you wish to choose is not that relevant, as long as it is agreed that what is being measured in the first instance is a proxy of the instantaneous energy of gas molecules or water molecules constituting the medium (air or sea water) whose ‘temperature’ is being taken. So I don’t think Richard needs to justify ‘temperature’ beyond that and i don’t think many people here would agree that a measurement of how warm or cold an air mass or water mass is at any given time is a fantasy created by meteorologists.
LikeLike
Well let’s look at Planck’s law. The intensity of radiation at frequency v and temperature T is
B(v,T) = (2 hv^3/c^2) 1/(exp(hv/kT)-1)
So to determine the temperature T for a body you measure the amount of energy the body gives off as a function of frequency. You need three physical constants, Planck’s Constant, the speed of light and Boltzmann’s constant. Clearly you misunderstood.
How about thermodynamic temperature? Efficiency of an ideal heat engine operating between two infinite temperature baths held at T2 (lower) and T1 (upper) is n = W/Q where W is the work you get out, Q is the heat energy you put in. Two energies. It is also equal to 1 – T2/T1, so ok, we have to define one temperature and we do. We use the triple point of water, 273.16 K where 0K is absolute zero (eg the temperature of the colder bath where the efficiency is 1, or if you will where the volume of an ideal gas is zero. All physical quantities., Clearly you misunderstood
LikeLike
Jaime Jessop says: 11 Feb 17 at 7:34 pm
“Will, The change over time of global mean surface ‘temperature’ is a convenient – though not particularly relevant and certainly not that accurate – measure of energy supposedly accumulating in the earth system. ”
Thank you Jaime,
I agree that ‘some value of temperature’ is a measurement of some physical property or combination, like (ratio) of multiple physical properties. But each of the three (‘properties’) being measured are independent of each other and therefor cannot be combined in any manner without intent to deceive!!
“Which technical definition of ‘temperature’ you wish to choose is not that relevant, as long as it is agreed that what is being measured in the first instance is a proxy of the instantaneous energy of gas molecules or water molecules constituting the medium (air or sea water) whose ‘temperature’ is being taken.”
I did not request the differences, as Eli did, only a physical definition of one! I seriously expect that not one of such can be unambigiously defined by anyone! .. For example atmospheric temperature is a measurement of atmospheric ‘sensible’ heat (a form of energy), but not a measure of the latent heat of evaporation of atmospheric WV (a different form of energy), nor is temperature a measure of atmospheric pressure (yet another form of atmospheric energy).
“So I don’t think Richard needs to justify ‘temperature’ beyond that and i don’t think many people here would agree that a measurement of how warm or cold an air mass or water mass is at any given time is a fantasy created by meteorologists.”
Here I disagree; when writing of ‘radiometric or brightness temperature’, one is not writing of energy but only a ‘potential’ for the maximum power transfer through a specific normalizing area with no thickness; thus no mass at all. It is this intentional confusion created by meteorologists over the meaning of temperature, that allows this scam to be promoted for financial or political gain. Such confusion was created by a very small number of folk, then all the greedy but unknowing others piled on!!
LikeLike
Eli Rabett says: 11 Feb 17 at 8:55 pm
“Well let’s look at Planck’s law. The intensity of radiation at frequency v and temperature T is
B(v,T) = (2 hv^3/c^2) 1/(exp(hv/kT)-1)”
There is no Planck’s law only Planck’s equation! for specific intensity ‘the maximum spectral radiance (previously spectral brightness)’, which you have not a definition either, As by definitional “a potential for radiative flux”, but never flux itself.
“So to determine the temperature T for a body you measure the amount of energy the body gives off as a function of frequency.”
If and only if there is no opposing ‘radiance’ at that frequency, Even then one can determine only the minimum conceptual temperature!! Can you or anyone define the word ‘temperature’? The measurement of such I have physically done for 40 years! Just what was I measuring? The measurement is the measurement of just what? Is your nonsense called science? Why?
LikeLike
Richard Betts was a co-author of this document from the Hadley Centre in 2005, just prior to Tony Blair’s Exeter Conference on Dangerous Climate Change:
“Stabilising climate to avoid dangerous climate change — a summary of relevant research at the Hadley Centre” January 2005 – Prepared by Geoff Jenkins, Richard Betts, Mat Collins, Dave Griggs,
Jason Lowe, Richard Wood
These points are from their summary, it should be noted that “the science was settled” even then:
Sir David King
https://www.theguardian.com/environment/2004/jan/09/sciencenews.greenpolitics
This from Betts at al:
“What constitutes ‘dangerous’ climate change, in the context of the UN Framework Convention on Climate Change, remains open to debate.
Once we decide what degree of (for example) temperature rise the world can tolerate, we then have to estimate what greenhouse gas concentrations in the atmosphere should be limited to, and how quickly they should be allowed to change.
These are very uncertain because we do not know exactly how the climate system responds to greenhouse gases.
The next stage is to calculate what emissions of greenhouse gases would be allowable, in order to keep below the limit of greenhouse gas concentrations. This is even more uncertain, thanks to our imperfect understanding of the carbon cycle (and chemical cycles) and how this feeds back into the climate system.”
It is no longer on the Met web site, but a copy can be found online here at this very alarmist site:
Click to access Dangerous%20Climate%20Change%201.pdf
LikeLike
From the JC blog: Mark Goldfinch | February 11, 2017 at 5:05 pm | Reply
“So what did you learn about “NOAA methodology and results”?
We learned that NOAA is a political organization, not a scientific one. We can now discount everything they say as being based on their political beliefs, not on any science that may accidentally be involved. Note that I say “may be”, because when your approach is to support your pet theory by cooling the past and warming the present, you have to say that there is no actual science here.
LikeLike