Vilifying Rose – a Tale of Two Standards
In the Mail on Sunday last week, David Rose penned an article pointing out the very sharp decline in RSS land only data to October 2016, indicating that ocean surface temperatures might also cool significantly soon and that perhaps scientists and the media over-played the role of man-made global warming in the spike in global temperatures in early 2016 which were precipitated by the natural warming event of El Nino 2015/16. Predictably, he has been vilified for doing so, called a denier, accused of cherry-picking the data to suit his ‘denialist’ agenda etc. etc. All pretty familiar stuff now to those used to observing the spectacle which is warmist kick-back against any who dare to question any aspect of ‘The Science’.
James Delingpole then joined the fray and published at Breitbart, referencing Rose’s article, pointing out the “icy silence” from climate alarmists following the large drop in land temperatures (as measured by RSS satellite but also, as it happens, by GISS and UAH). Warmist fury peaked El Nino-like when the House of Representatives Committee on Science, Space & Technology had the audacity to tweet a link to Delingpole the Denier’s Breitbart article. Cue rants from the Keepers of the True Science of Climate Change and numerous other lesser warmist offendotron minions.
The main objection to Rose’s article is that he ‘cherry-picked’ land only data from the RSS lower troposphere dataset and ignored the oceans (he did not) and that (bizarrely) he cherry-picked two data points and ignored the longer record. The whole point of Rose’s article is that this is exactly what the media and scientactivists were doing when they hyped the El Nino to promote the anthropogenic global warming message! And they did. There is no doubt about that (as we shall see).
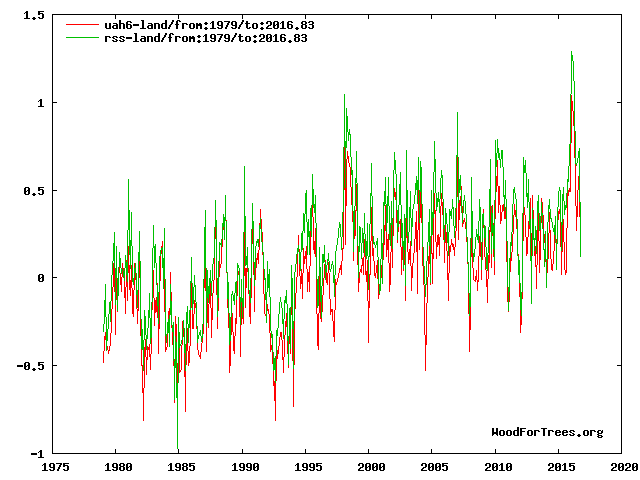
Firstly, let’s examine whether Rose’s ‘cherrypick’ of the RSS land only data was indeed a cherrypick. As you can see, UAH shows a very similar drop:
The GISS land only dataset shows a similar large decline:
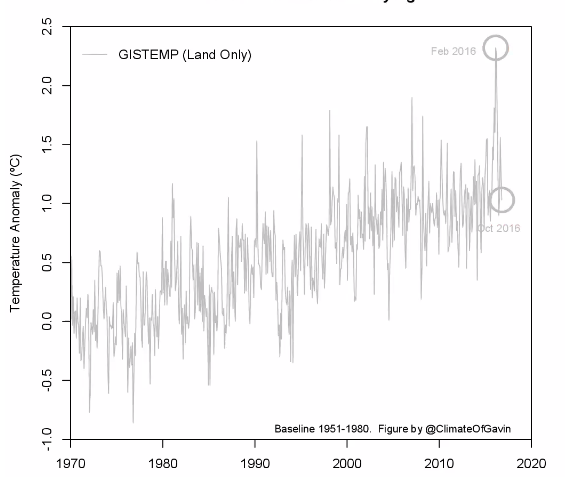
So obviously, it was not simply Rose cherry-picking the data because the evidence is there : over land, temperatures dropped precipitously from Feb to Oct 2016. As Rose points out, the ocean data has been slower to respond, but it’s reasonable to speculate that, in 2017, the oceans might continue to cool (as they are now, and especially if a strong La Nina kicks in), whereupon the Pause in global warming might re-establish itself in which case the El Nino of 2015/16 will come to be seen as a short term weather event only, contrary to the hype we saw from scientists and the media at its peak. Of course, there is the possibility global temperatures might remain at a new higher level in which case we can say that El Nino has contributed to the long term global warming trend (as in 1998). The fact remains, however, most of the short term increase in temperature that we saw over 2014/15/16 can be attributed to the building super El Nino, not GHG global warming. This was not what scientists and the media were saying when El Nino peaked:
Adam Scaife (Met Office):
The vast majority of the warming is global warming, but the icing on the cake is the big El Niño event”
We think El Niño made only a small contribution (a few hundredths of a degree) to the record global temperatures in 2015.
The forecast for next year is about 0.8C above the 1961-1990 baseline. About 0.2 of that is likely to come from El Niño, hence the 25%
Peter Stott (Met Office):
El Nino will have contributed a “small amount on top” to the global warming of 2015/16.
When the peak did happen, Gavin was like, ‘Wow’ and this was ‘special’:
The Guardian, supported by comments from a number of scientists, concluded that the global warming occurring at the time was “shocking” and that it constituted a “climate emergency”. Which is odd because scientists are now publicly criticising Rose for writing an article which basically points out (correctly) that global warming was being hyped as the main cause of the extreme global temperatures in early 2016, using the current precipitous drop in RSS land temperature to back up his claim. I say ‘scientists’; well, some of them are. Lew also wades in with a critical guest comment:
This article is flawed to perfection. Mr. Rose made the following inadvisable choices:
1. Ignore the surface temperature record and use only satellite data. Satellites do not measure temperature, they measure microwave radiation, which can be related to an estimate of temperature by use of a computer model. The resulting estimate is, however, not only of temperature at the surface of the Earth—which is where we live—but includes temperature at altitudes of thousands of feet—where no one is trying to farm or grow tomatoes.
2. Ignore two-thirds of the satellite record. Most of the Earth is covered in ocean, and global warming is called global warming because it is global—that is, it includes the oceans.
3. Ignore the trend and focus on two data points. A long-standing trick of people who deny the overwhelming scientific consensus regarding climate change is to cherry-pick isolated observations. The only way to support the claim of a 1-degree drop in the satellite record is by comparing February 2016 to October 2016. This drop, however, is merely weather that is superimposed on the long-term climatic trend.
Highly amusing. Psychology professor criticises journalist for misrepresenting climate science!
The whole rebuttal is a disgrace to be honest. It accuses Rose of saying things he did not say and totally misrepresents what he did actually say. As David Rose points out on Twitter, the fact that the Guardian article above was not attacked for supposed inaccuracy by climate scientists but his article has been is a perfect example of the global warming crowd’s double standards:
Update 11 Dec 2016:
David Rose has published again in the Mail on Sunday:
“Now SECOND set of data shows world temperatures have cooled… and spikes were caused by El Nino – NOT by man”
Taken up by the GWPF:
I think it unlikely that there will be anything more than a few muted mutterings on warmist blogs because the simple, undeniable fact of the matter is, the majority of the global warming we saw in 2015/16 is almost definitely attributable to El Nino, with only a minor contribution from the long term trend. The undeniable fact is, climate scientists and the media falsely attributed ‘most’ of the global warming at the time to GHGs. To suggest that they did not is absurd.
The reason why this [2015] is such a warm record year is because of the long-term warming trend, and there is no evidence that that warming trend has slowed, paused, or hiatused at any point in the last few decades,” he told reporters.”
[Gavin Schmidt, Jan 2016]
http://www.bbc.co.uk/news/science-environment-35354579
But should El Niño and climate change be given equal billing?
No, according to Professor Michael Mann, the director of Penn State Earth System Science Centre. He said it was possible to look back over the temperature records and assess the impact of an El Niño on global temperatures.
A number of folks have done this,” he said, “and come to the conclusion it was responsible for less than 0.1C of the anomalous warmth. In other words, we would have set an all-time global temperature record [in 2015] even without any help from El Niño.
https://www.theguardian.com/environment/2016/mar/04/is-el-nino-or-climate-change-behind-the-run-of-record-temperatures
Just two examples among many.
The plain truth is that climate scientists leapt on the opportunity to hype the global warming message when El Nino was at or near its peak and, in doing so, they behaved less like scientists and more like political advocates.

I particularly liked Lewandowsky’s comment:
But no-one’s trying to farm or grow tomatoes in the ocean either, or at the poles. Yet that’s where the frightening heat is, and Rose was specifically criticised for ignoring the ocean data.
LikeLiked by 4 people
You couldn’t make it up Geoff, could you. Chastises Rose for ignoring the oceans then chastises him for including atmospheric data in places where nobody is growing tomatoes! I must get me some of those juicy red ‘marine’ beef tomatoes which they grow in the middle of the Pacific.
LikeLiked by 2 people
“Satellites do not measure temperature, they measure microwave radiation, which can be related to an estimate of temperature by use of a computer model. The resulting estimate is, however, not only of temperature at the surface of the Earth—which is where we live—but includes temperature at altitudes of thousands of feet—where no one is trying to farm or grow tomatoes.”
I’ve heard this dismissal of satellite data several times now, it doesn’t really seem to make sense. Applying the same logic a thermometer does not measure temperature but the expansion of mercury in a sealed tube. Likewise an electronic temperature probe doesn’t measure temperature but changes in conductivity.
Surely measuring temperature at high altitudes gives an insight into the amount of energy arriving from space and the amount leaving, which is kind of the WHOLE POINT?
LikeLiked by 2 people
Jaime
On those juicy red ‘marine’ beef tomatoes which they grow in the middle of the Pacific: remember that ocean temperatures are measured from buoys below the surface, in order to be comparable with the historical record derived from buckets made of leather or oak, while land temperatures are measured five feet off the ground. Not so much apples and oranges as potatoes and runner beans.
The fact of including the ocean temperatures in the temporal record at all is one of those bizarre decisions which could only be made by someone of a bureaucratic disposition, even if it’s a bureaucrat with a PhD in Climate Science.
Being science-minded folk ourselves, we tend to precede our arguments with an unspoken: “Let’s admit for the sake of argument that…” and after twenty years of non-debate, we often tend to forget just how much we have conceded to the anti-scientists on the other side.
Temperature measurement over time began in the seventeenth century and has continued uninterrupted in a very small number of sites (Central England, County Antrim, Prague, I seem to remember. Does anyone have a good reference for this?) Why did someone insist that a “proper” measure must include the southern hemisphere, where there’s little land and less big population centres? And then insist that ocean temperatures also must be included? I can imagine someone in a government department saying: “But look here, three quarters of the earth is covered in water you know. You can’t just leave it out.” But a scientist?
LikeLike
Great for pointing it out
LikeLike
A rose by any other standard…
LikeLike
That bit about the satellite measurement being of the lower troposphere not on the surface where people farm, is a red herring. The lower troposphere is the part of the atmosphere closest to the surface, and as such derives its temperature solely from the surface. It can not get warmer or cooler unless the surface does the same. It is therefore a fairly accurate picture of what is happening on the surface beneath it
LikeLike
Tomatosphere: that part of the Earth where tomatoes grow.
LikeLiked by 3 people
Ed Hawkins is berating David Rose in a deeply unpleasant manner. How dare Rose speak. The stupidity is Hawkins is using days from 1850 and going off on short term causes. It’s bullying groupthink. Absolutely disgusting behaviour.
LikeLiked by 1 person
So, Ed Hawkins suggests (demands?) that David Rose repeats the warmist mantra as fact in his next article in penance for him being a very naughty boy with the current article!
LikeLiked by 2 people
Data from 1850 – back when the temperature measuring network was not only fundamentally different in terms of density and coverage but also instruments had a range of error of at least one degree.
It’s utterly ludicrous.
LikeLiked by 2 people
When the temperature rises it’s global warming (all man-made of course). When the temperature falls it’s just weather (natural of course). That is post-modern climate “science” as practiced by corrupt taxpayer funded propagandists.
LikeLike
“Alan Kendall says:
04 Dec 16 at 7:29 am
Tomatosphere: that part of the Earth where tomatoes grow.”
I’m afraid we’re in severe danger of straying into the realm of vegifruitophobia here. What about avocados? Mangos? Kohlrabi?
I want climate justice for the mango farmers of the West Antarctic Shelf.
LikeLiked by 1 person
Allen Esp, measuring temperature from satellite is not in any way close to using a thermometer. The sat. is measuring radiation from oxygen atoms in the whole column (or stripe) beneath it. These measurements must then be processed heavily to try to extract a signal from just the troposphere and reject the signal from the stratosphere and above and from competing radiation sources on land. Processing involves computer models and all sorts of corrections.
Geoff the ‘marine’ beef tomatoes are called fish. Humans eat lots of them but if we interfere with their habitat, maybe we won’t.
LikeLike
“Satellites do not measure temperature, they measure microwave radiation, which can be related to an estimate of temperature by use of a computer model.”
I am not saying that a thermometer and a satellite operate in a similar way. What I am saying is that the above statement is nonsensical in the sense that a difference in temperature is always inferred from the behaviour of a device that is exposed to it. Using his logic it is true that satellites do not in the strictest sense “measure temperature” but nor does any other instrument designed to, er, measure temperature.
LikeLiked by 2 people
The instrumentation on board satellites measures the microwave radiation emitted by oxygen molecules in the atmosphere – which is directly proportional to the temperature of the atmosphere where those molecules are. Therefore the instrumentation on board a satellite is a remote sensing thermometer. Most thermometers, as Allen Esp points out, don’t directly measure “temperature” (which is a measure of the time-averaged kinetic energy of all molecules in a given medium); they measure a proxy for temperature, e.g. resistance of a thermistor, expansion of column of mercury.
So this argument that satellites aren’t thermometers or don’t measure temperature is bogus. It is true to say that, in order to arrive at an estimate of the temperature of a layer of atmosphere, rather more processing steps are involved than getting a more ‘direct’ measurement of air temperature from a thermometer at a surface station. But there again, ‘raw’ station data is rarely used in surface datasets; even that is processed/homogenised/adjusted to get the ‘right’ answer.
LikeLike
> So this argument that satellites aren’t thermometers or don’t measure temperature is bogus.
Exactly. It’s like saying “you don’t hear sounds, you hear
compression waves in airvibrations of the tympanum
vibrations of the bones of the inner ear
action potentials in fibres of the auditory nerve…”
Nope, I hear sounds.
LikeLiked by 2 people
Please note, however, that satellites are NOT, in fact, thermometers.
Thermometers aren’t thermometers either—they only measure the expansion of a column of mercury.
The only thing that *is* a thermometer is a Tiljander varve oriented the wrong way up.
LikeLiked by 4 people
Hi, Jaime.
Keep up the good work 🙂
LikeLiked by 1 person
Hi Stephen,
Welcome to our little haven of climate denial!
LikeLike
I’m happy to join, what do I need to do ?
Meanwhile I’m promoting my own hypothesis as to how the Earth system actually responds to solar variability rather than CO2 emissions:
http://joannenova.com.au/2015/01/is-the-sun-driving-ozone-and-changing-the-climate/
It seems to be working well so far.
LikeLiked by 1 person
Apparently Gavin Schmidt gets bored.
LikeLiked by 1 person
NINO (04 Dec 16 at 1:35 pm)
And “interfering with their habitat” is called fishing.
And my tomatoes move around in shoals looking for a habitat where they feel comfy and well fed, though I haven’t yet managed to get them to jump rapids.
LikeLiked by 1 person
Seemed like a demand to me. Rose should demand that Hawkins berates the bored one Schmidt et al for their bandwagon jumping on the El Ninõ hype. But they won’t because you only suffer when break omerta.
LikeLike
Geoff, fishing is more like interfering with their person. Interfering with habitat is obviously things like changing the water temperature, pH, salinity, nutrients, predator/prey balance (so fishing can change habitat) etc. The fact that fish can move does not mean that the food chain they depend upon necessarily moves with them, though I imagine you’ll tell me that of course it does.
Jaime, I’d say there’s a significant difference between taking a reading on a thermometer, thermocouple or IR device and reading the temperature off a corresponding calibration curve, and capturing O2 emissions from the atmospheric column and ground emissions and using much processing and models to try to extract the temperature from the fraction of the O2 molecules furthest away. In my reckoning the MSU/AMSU is not the thermometer in itself; only by adding the required processing system (the equivalent of the calibration curve built into a real thermometer) do you get a ‘thermometer’. In the same way, a mercury column with no engraved/painted scale is not a thermometer, although I guess you’d have to say it is.
LikeLike
I am rather concerned about the quality of biological knowledge being displayed here. It is not unusual for people to mistake some animals for plants – bryozoans and coelenterates especially – but to confuse fish for tomatoes takes some doing. I can even understand some confusing tomatoes for animals since each comes with its own five-legged “spider” (used by the young to scare the bejesus out of arachnophobic siblings) BUT FISH!!!!
To forestall further inanities, I am aware of sea potatoes, anemones and cucumbers.
LikeLike
Well, it seems by “rushing to Rose’s rescue”, I am starting to annoy all the right (wrong) people. Tamino has kindly taken the time out to diss this here article of mine on his own eminent blog, Open (Closed) Minds. No real substance to his objections, as one might expect, other than the intimation that Rose had a dark “purpose” to push the idea that the the record-breaking heat in 2015/16 had “nothing to do” with the long term global warming trend and that I scurrilously defended his ‘cherry-picking’ by ignoring Rose’s obvious nefarious intent.
“Jaime Jessop’s defense is a disgrace.”
Apparently not enough of a disgrace for him to comment here, at the disgrace’s beating heart, as it were, to rationally defend his opinion.
LikeLiked by 2 people
Tamino’s attempted put down contains a handy graph under the comment:
What’s handy is that you can pick a variety of cherries from it, but wherever you start picking within the past century or so you get a trend of roughly plus 1-1.5°C. Of course he’s drawn a cherry-flavoured smoothy with no Pause, but ther’s no uptick either.
LikeLike
If any of them do deign to grace us with their presence perhaps they can explain why and how the temperature sensing network from 1880 and before is in any way comparable to the temperature sensing network today.
The kind of divergence in measuring locations, density and devices used would not be accepted in any other science.
LikeLike
I’m happy to join the ‘Disgracefuls’! I’m already a ‘Deplorable’ and ‘Den!er’ so I’ll now be in 3D. 😉
LikeLiked by 1 person
Dana N has weighed in with his 0.000000000002’penceworth
It’s almost sweet, his concern for truth. But I’m sure I’m not the only person to be surprised to read that Dana is against polarisation.
LikeLiked by 1 person
Geoff, I don’t know where Tamino gets this ‘NASA’ graph from – I suspect it’s some sort of reworking of GISS – but it looks fraudulent to me. The 1998 El Nino has been consigned to just ‘noise’, 1940s-60s cooling all but obliterated, then we have this massive spike right at the end which supposedly is only the ‘little bit on top’ of the man-made global warming trend contributed by El Nino. Total joke. This is Hadcrut 4 surface data from 1979:
Here is its predecessor, Hadcrut3, in a longer version (up to 2010):
LikeLike
“Tamino” is one of the most notorious and dishonest graph-fakers. His was one of the blogs that helped to create my climate scepticism in about 2007.
An honest man who wanted to present the NASA data would have just gone to the NASA GISS site and shown this
What’s particularly dishonest about Tamino’s graph is what I call “Stefan’s smoothing trick”.
The thick red line is clearly smoothed, some kind of moving average. And because it’s very smooth, it must be an average of quite a large number of years either side. Now that’s fine in the middle, but what do you do at the edges, where you don’t have enough data to do the average? When I first asked a climate scientist (Rahmstorf) how they did this, I was quite gobsmacked that he refused to answer the question. The honest thing to do, if you were using, say, ten years data either side to do your averaging, would just be to stop the smoothed red line 10 years ago in 2006. But team Tamino-Rahmstorf-Mann don’t do this. They make a bunch of assumptions about future temperatures and use those to plot their graphs, without even telling people that they do this. Then, if the resulting graph doesn’t seem to tell the story they want to tell, they just change the smoothing method until they get a picture they like – again without telling anyone.
This has all been discussed at length at Climate Audit and The Blackboard and David Stockwell’s blog. See for example this at CA and my favourite at Lucia’s Blackboard, Source of fishy odor confirmed: Rahmstorf did change smoothing.
LikeLiked by 1 person
Well I like Tamino’s graph, even if no-one else does. So what if he made it up? He made it up to show something, and managed to show the opposite. Has no-one ever pointed out to climate scientists that you’re SUPPOSED to cherrypick, looking for the worst example for your case and explaining it? His best cherrypick, as far as I can see, is c1970 to the present. What he gets is a slope of roughly 1.5°C per century with a one month red blob on the end. (Could that be Andrew Simms?) Is he saying he’s found a hockeystick, or what?
LikeLiked by 1 person
Just wondering whether I should bother to write a detailed response to his ridiculous accusations and assertions on my own blog. Probably not worth the effort so I’ll write a rather more brief response here.
His main rant against Rose (and me for defending his article) is that Rose is trying to promote the ‘denialist lie’ that the recent “spate of records (soon to include three record-breaking hot years in a row)” has nothing to do with global warming (the long term trend) and everything to do with El Nino.
As a Pause Denier of course, Tamino would have his readers believe that this trend has been operating essentially unimpeded throughout the 21st century. It hasn’t however and until El Nino arrived, warming during this period in most datasets has been weak, statistically insignificant, flat or slightly negative according to which dataset you use and which particular start and end points you use (tut, tut, more cherry-picking!).
Thus it was that the ‘record warm year’ of 2014, very publicly and ceremoniously announced by NASA nearly two years ago turned out to be the ‘hottest’ only by a margin of two one hundredths of a degree! So tiny was this margin that, in reality, as NASA admitted, they could only be 38% sure that it was a record even! The Met Office conceded that 2014 could not be statistically distinguished from a series of several other possible warmest years in its data after 1998, because . . . . the Pause!
Statistically significant warming started in 2015 – strangely coincident with the start of El Nino 2015/16 – hence 2015 and 2016 will both be record warm years by a statistically significant amount (though it’s uncertain if 2016 will exceed 2015 by a very large margin). A lot of that warming has been reversed by the post Nino drop in temperatures. For instance, in October 2016, Hadcrut4 was back at the point it was at at the end of 2013. Hence, in a very real sense, we can say El Nino caused the record warm years of 2015/16 by pushing global temperatures way above the level at which they had been ‘paused’ at since the beginning of the century. This is not how climate scientists were portraying the situation at the time, and certainly not the climate alarmist media. 2014, the other ‘record warm year’ in the ‘run’, was only nominally so.
It stands to reason that El Nino pushed temperatures into record territory from an elevated baseline – the ‘step change’ of 0.2C or so created by the former super El Nino (which added to the long term warming trend – man-made or otherwise). But, it was El Nino that did most or all of the pushing, NOT ‘global warming’. hence Rose was right to attack the climate alarmist hype we saw during the peak, hence Tamino is talking nonsense, some of it quite spiteful and juvenile at that.
LikeLiked by 3 people
That this story got such legs (even SciAm was denouncing the simple truthful observation as false news from deniers) is an indication of its power. All the 2015/16 warmest ever media stuff never mentioned El Nino. Now that its over, thatnomission is more than just inconvenient. It exposes the media claims as deliberately misleading, like so much else in the CAGW world.
LikeLike
More from the GWPF: “Despite Denial, Global Temperatures Are Dropping Fast”
http://www.thegwpf.com/despite-denial-global-temperatures-are-dropping-fast/
LikeLike
Paul, I’d expect a mathematician to have a better idea of smoothing. Tamino usually uses a Lowess smooth. He talked about it extensively here: https://tamino.wordpress.com/2014/01/11/smooth-3/
Lowess is the same method used at http://data.giss.nasa.gov/gistemp/graphs/ – where your ‘honest’ graph is shown by clicking the “Global Monthly Mean Surface Temperature Change ▶” ‘link’. Was that the only ‘honest’ graph on the page. The 1st one there is quite similar to Tamino’s but with a shorter smoothing window.
LikeLike
Nino is Raff. Isn’t Raff banned?
Fake name. Fake IPs. Fake email address.
Pretty weird people, these online climate warriors.
LikeLiked by 2 people
fake IP, and Fake email address = ban at most blogs (independent of ‘side’)
LikeLiked by 2 people
“Nino is Raff.”
I don’t mind. I wouldn’t like our blog to ban crossdressers, as long as they don’t frighten my tomatoes.
LikeLiked by 1 person
Oooh, not so passive, rather aggressive response over at Closed Mind. My second comment also in moderation:
https://tamino.wordpress.com/2016/12/05/global-warming-and-el-nino/#comment-97492
Unlike Closed Mind, we’re quite Open here, even to the point of allowing people like Raff/Nino to comment freely using a fake email and IP address. It would be nice if that policy had led to substantive challenges from the ‘other side’, but it seems they lack the cojones for that. All we get are weasel words and trolling from the ‘unofficial’ opposition.
LikeLiked by 1 person
Jaime Jessop says: 04 Dec 16 at 4:19 pm
“The instrumentation on board satellites measures the microwave radiation emitted by oxygen molecules in the atmosphere – which is directly proportional to the temperature of the atmosphere where those molecules are. Therefore the instrumentation on board a satellite is a remote sensing thermometer. Most thermometers, as Allen Esp points out, don’t directly measure “temperature” (which is a measure of the time-averaged kinetic energy of all molecules in a given medium); they measure a proxy for temperature, e.g. resistance of a thermistor, expansion of column of mercury.”
Jaimie,
Not to pick nits with you, as your statement is literally correct, technically it is crap, as the word ‘temperature’ is so ill-defined that such can be only a vague concept. The term ‘temperature’ can only be used to confuse unless a specific context precedes each such use! Even your “measure “temperature” (which is a measure of the time-averaged kinetic energy of all molecules in a given medium);” while technically correct is loaded with confusion as ‘time-averaged kinetic energy of all molecules in a given medium’ does not distinguish between coherent mv²/2 (ke of a bullet) and gaseous d(mv)/dt (combo mass, velocity, density, and temperature)!
The important part is that whatever temperature may be; Temperature can not ever cause something. Temperature can at best ‘only’ be a measure of existing state\action of some mass!
LikeLike
Will,
(Classical) Kinetic Theory of Matter
“The temperature of a substance is a measure of the average kinetic energy of the particles.”
Is that less confusing?
LikeLike
Jaime Jessop says: 04 Dec 16 at 4:19 pm
“The instrumentation on board satellites measures the microwave radiation emitted by oxygen molecules in the atmosphere – which is directly
proportionalrelated to the temperature of the atmosphere where those molecules are.”again not to pick nits! 🙂
LikeLike
Jaime Jessop says: 05 Dec 16 at 11:14 pm
Will, (Classical) Kinetic Theory of Matter
(“The temperature of a substance is a measure of the average kinetic energy of the particles.”)
“Is that less confusing?”
No! Such is exact only if using a very strict interpretation of Newtons KE = d(mv)/dt for the random velocity vector of gas molecules! The continual change in angular momentum of orbiting planets has nothing to do with their temperature; or does it?
-will-
LikeLike
The trouble is that the radiation picked up by satellites comes from all levels of the atmosphere below it and some from the surface. The problem then is to extract that part of the radiation that came from the troposphere (etc), while at the same time adjusting for time of observation, orbital decay and dozens of other factors. It is not a simple matter, which is why RSS chief Mears says the surface measures are a better measure of surface temperatures (unsurprisingly).
LikeLike
Len Martinez says: 05 Dec 16 at 11:45 pm
“It is not a simple matter, which is why RSS chief Mears says the surface measures are a better measure of surface temperatures (unsurprisingly).”
Indeed! And why any competent MD will admit that a rectal thermometer is best for detecting infection\trauma in an infant! (unsurprisingly)
LikeLike
Its not going to help to rehash the satellites vs. surface station argument which is a false choice. Both datasets offer insight into the climate system and should be used and studied. I personally think a labor intensive station by station approach would be good. Have an actual scientist look at the historical record for every station you want to add to the database and try to come to some conclusion about adjustments that need to be made.
LikeLike
dpy6629 says: 06 Dec 16 at 1:18 am
“Its not going to help to rehash the satellites vs. surface station argument which is a false choice.”
A measurement of ‘something’ remains a measurement of ‘something’ here\now. Even if the measurer has no idea of what that something may be! Most measurement is not trivial, but the very best measurement that can be done here\now of that something! Any adjustment of the numbers obtained by such measurement must be treated by all society as the most obscene travesty of science possible!
All sort of discovery of ‘what was measured’, and errors of measurement of such, can be explained with sorrow of stupidity. The numbers of the ‘original’ measurement must remain pristine! I still ‘thunk’ at digital readouts, trying desperately to get a better ‘measurement”!
-will-
LikeLike
Rose did not write something wrong. But as a skeptic I just ask for objectivity.
-He did not state which graph he is using.
-He took the one with the biggest drop, RSS land only.
-RSS itself warned not to use the data as real, but just for comparsion.
-As we have a special cold in siberia, this helps to cool tand only graphs – neglecting a warm arctic.
Maybe he didn’t know about this. And the other side clearly overrreacted.
But what could we do better?
Either using a number of different graphs for comparision or using an average of the main graphs. Woodfortrees.org Temp Grap possibly.
What would be an objective statement?
“After a steep rise of 0.6°C during El Nino, the average global dropped 0.5°C, comming close the 2014 level. Seems the El Nino warming is nearly over. Still it is unclear if a strong La NiNa is following, with further declining temperatures.”
He could also remark, that several land temperatures dropped even deeper, possibly bc of cold siberian land masses. And that the end of any graph is just weather and not a long time trend.
Okay, but That would not give such dramtic headlines. Possible the headline still could use the Land Temp, but in the article the rest from above should also be mentioned.
LikeLiked by 1 person
JOHANNES S. HERBST (07 Dec 16 at 8:14 am)
You’re right that Rose could have done better. But he’s practically alone as a serious sceptical journalist on a popular newspaper, against hundreds of mindless environmentalist journalists in the ‘serious’ papers and hundreds of scientists who can tweet anything they like and not be held to account. Nothing he said was wrong, it was simply open to attack. And this attack can be quite subtle – see for instance Chris Mooney,
https://www.washingtonpost.com/news/energy-environment/wp/2016/12/06/its-likely-earths-warmest-year-on-record-and-people-are-already-talking-about-cooling/?utm_term=.e3ca6db86801
who under a veneer of fairplay, manages to convey the impression that Rose is wrong and ‘the science’ is right.
Yes, we have to hold to the highest standards of objectivity in order not to be open to attack, but this insistence on higher standards has the paradoxical result that we start to behave like a sect. And we are a sect, Puritan/Shia/Hassidic science-supporters in an agnostic world.
Which is why I lke to throw off my eighteenthth century garb from time to time and say that Sir Paul Nurse (or whoever) is a miserable little squirt and I wouldn’t trust him to give me the right change for a ten bob note.
LikeLiked by 1 person
“As we have a special cold in Siberia, this helps to cool tand only graphs – neglecting a warm arctic.”
Language. The cold in Siberia is ‘special’, but the Arctic is ‘warm’, as in global warm? In reality, the two extremes are related. Siberia – being land – would be included in a land only dataset, whereas, of course, much of the Arctic is open ocean. Did Rose deliberately pick RSS land only so as to include Siberia? I very much doubt it. Rose points out that the oceans have been slower to cool but might reasonably be expected to cool further in 2017, perhaps re-establishing the Pause in global warming.
On the subject of the anomalously warm Arctic this winter, NSIDC have pointed the finger at an ‘unusual’ jet stream pattern pushing cyclones (and warmer N Atlantic water) into the Arctic Ocean through Fram Strait (between Svalbard and Greenland). This has been at least ‘partly’ responsible for the warm air temperatures and record low sea-ice extent. It is also directly related to the extreme cold in Siberia.
https://notalotofpeopleknowthat.wordpress.com/2016/12/06/nsidc-confirm-low-arctic-ice-due-to-influx-of-warm-atlantic-water/
As with so many hot and cold extremes and extreme weather currently occurring across the globe, it comes down not so much to ‘global warming’ but to ‘unusual’ jet stream behaviour – which, naturally, warmists have also tried to pin on global warming (with very limited success, bordering on complete failure!)
Rose maybe could have ‘done better’, (we can all look back at things we have written and see room for improvement) but his argument still stands and any minor improvements would have made no difference whatsoever as regards the response from the warmist establishment.
LikeLike
If Geoff Chambers offered anyone a ‘ten bob note’ he would be asking for trouble as it was withdrawn in 1970.
http://en.wikipedia.org/wiki/Bank_of_England_10s_note
But we get the idea 🙂
LikeLike
Tim Osborne’s series of tweets defending the notion that El Nino’s effect upon the recent run of consecutive warmest years was minimal is a wonder to behold. He ends up deferring to Tamino for the final lowdown.
LikeLike
Jaime, LOL. David Rose said land temp had fallen by 1C in 2016. But Tim Osborn says land temp fell by 1C in 2016.
LikeLike
Paul,
Tim tweeted me this, which I find a bit odd coming from a scientist, but I kind of got the point.
Surface temperature is surface temperature, an objective measure of how hot or cold it is at the surface. Assigning additional “weather” and “climate” labels to GMST seems a tad unscientific. Of course the long term trend is likely to be climate-related whereas short term trends are more likely to be weather related. I don’t think anyone has been disputing this.
The issue is how much of an influence did the long term trend have on the short term trend? That includes the warming part as well as the cooling part. I haven’t seen any really convincing argument in favour of suggesting that the rapid warming and even more rapid cooling we’ve seen over 2015/16 is anything other than “weather”, with maybe just a tiny contribution from the long term global warming trend, which is exactly what Rose pointed out. But it seems scientists just cannot admit to themselves or anybody else that the warming which we saw at the peak of El Nino was ludicrously hyped by the press and even scientists themselves to sell the anthropogenic global warming message.to a gullible public.
LikeLiked by 2 people
The Daily Express has arguably transgressed the global warming code of ethical publishing by an even larger amount today, rehashing the ‘old chestnut’ of an impending mini ice age. Will the author of this piece attract as much criticism from the climate science community as did Rose for merely pointing out a post Nino drop in temperatures?
http://www.express.co.uk/news/science/741841/ICE-AGE-COMING-solar-activity-reaches-low
It’s the anti global warming horror story which just won’t go away. Why, I wonder? Because observations, because, despite their bestest efforts, AGW convinced scientists can’t quite conjure up the irrefutable science which suggests that a new Maunder-type solar minimum will be anything but a very minor blip in the planet’s inexorable progress towards CO2 thermageddon.
LikeLike